
|
Shanghai Qifan Cable Co., Ltd (605222.ss) Valoración de DCF |
Completamente Editable: Adáptelo A Sus Necesidades En Excel O Sheets
Diseño Profesional: Plantillas Confiables Y Estándares De La Industria
Predeterminadas Para Un Uso Rápido Y Eficiente
Compatible con MAC / PC, completamente desbloqueado
No Se Necesita Experiencia; Fáciles De Seguir
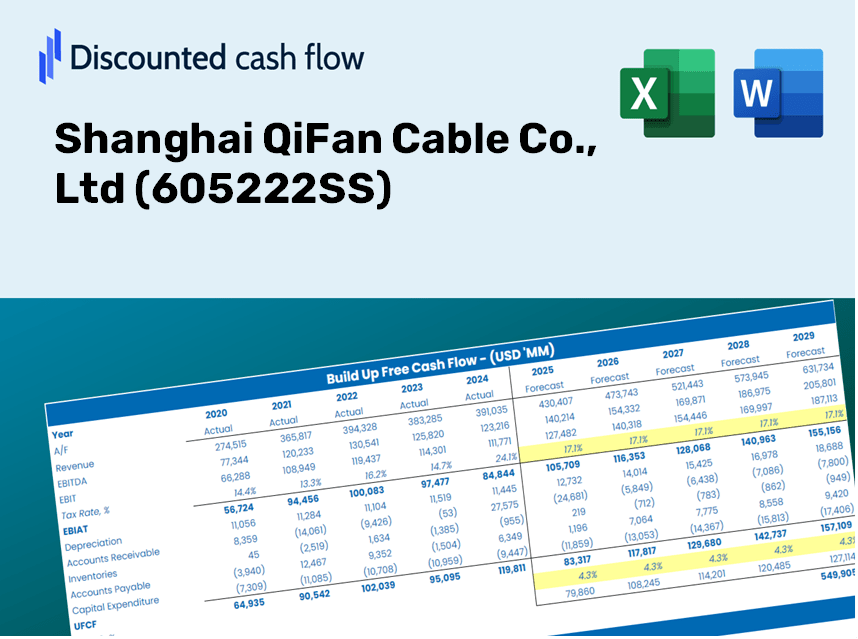
Shanghai QiFan Cable Co., Ltd (605222.SS) Bundle
¡Simplifique la valoración de Shanghai Qifan Cable Co., Ltd (605222ss) con esta calculadora DCF personalizable! Con el verdadero Shanghai Qifan Cable Co., Ltd (605222ss) finanzas y entradas de pronóstico ajustables, puede probar escenarios y descubrir el valor razonable de Shanghai Qifan Cable Co., LTD (605222SS) en minutos.
Discounted Cash Flow (DCF) - (USD MM)
| Year | AY1 2020 |
AY2 2021 |
AY3 2022 |
AY4 2023 |
AY5 2024 |
FY1 2025 |
FY2 2026 |
FY3 2027 |
FY4 2028 |
FY5 2029 |
|---|---|---|---|---|---|---|---|---|---|---|
| Revenue | 9,735.9 | 18,877.5 | 20,644.2 | 23,348.4 | 22,764.1 | 29,243.5 | 37,567.0 | 48,259.7 | 61,995.9 | 79,641.8 |
| Revenue Growth, % | 0 | 93.9 | 9.36 | 13.1 | -2.5 | 28.46 | 28.46 | 28.46 | 28.46 | 28.46 |
| EBITDA | 642.1 | 1,081.7 | 827.8 | 781.4 | 471.4 | 1,272.3 | 1,634.4 | 2,099.6 | 2,697.2 | 3,465.0 |
| EBITDA, % | 6.6 | 5.73 | 4.01 | 3.35 | 2.07 | 4.35 | 4.35 | 4.35 | 4.35 | 4.35 |
| Depreciation | 63.6 | 77.1 | 95.7 | 121.8 | 150.0 | 158.3 | 203.3 | 261.2 | 335.5 | 431.0 |
| Depreciation, % | 0.65356 | 0.40867 | 0.46346 | 0.52145 | 0.65874 | 0.54117 | 0.54117 | 0.54117 | 0.54117 | 0.54117 |
| EBIT | 578.5 | 1,004.5 | 732.2 | 659.7 | 321.5 | 1,114.0 | 1,431.1 | 1,838.5 | 2,361.7 | 3,034.0 |
| EBIT, % | 5.94 | 5.32 | 3.55 | 2.83 | 1.41 | 3.81 | 3.81 | 3.81 | 3.81 | 3.81 |
| Total Cash | 834.5 | 2,704.4 | 2,217.3 | 2,689.6 | 2,171.0 | 3,198.9 | 4,109.4 | 5,279.1 | 6,781.7 | 8,712.0 |
| Total Cash, percent | .0 | .0 | .0 | .0 | .0 | .0 | .0 | .0 | .0 | .0 |
| Account Receivables | 2,230.8 | 3,009.2 | 4,005.9 | 4,553.7 | 4,942.7 | 5,817.9 | 7,473.9 | 9,601.2 | 12,334.0 | 15,844.6 |
| Account Receivables, % | 22.91 | 15.94 | 19.4 | 19.5 | 21.71 | 19.89 | 19.89 | 19.89 | 19.89 | 19.89 |
| Inventories | 1,787.1 | 2,010.1 | 3,988.1 | 3,939.3 | 3,701.7 | 4,764.1 | 6,120.1 | 7,862.0 | 10,099.8 | 12,974.5 |
| Inventories, % | 18.36 | 10.65 | 19.32 | 16.87 | 16.26 | 16.29 | 16.29 | 16.29 | 16.29 | 16.29 |
| Accounts Payable | 784.0 | 1,314.2 | 385.5 | 729.6 | 2,118.1 | 1,714.3 | 2,202.3 | 2,829.1 | 3,634.3 | 4,668.8 |
| Accounts Payable, % | 8.05 | 6.96 | 1.87 | 3.12 | 9.3 | 5.86 | 5.86 | 5.86 | 5.86 | 5.86 |
| Capital Expenditure | -74.2 | -254.6 | -210.8 | -314.9 | -475.1 | -384.1 | -493.5 | -633.9 | -814.3 | -1,046.1 |
| Capital Expenditure, % | -0.76175 | -1.35 | -1.02 | -1.35 | -2.09 | -1.31 | -1.31 | -1.31 | -1.31 | -1.31 |
| Tax Rate, % | -9.01 | -9.01 | -9.01 | -9.01 | -9.01 | -9.01 | -9.01 | -9.01 | -9.01 | -9.01 |
| EBITAT | 429.4 | 753.4 | 542.4 | 487.8 | 350.5 | 885.1 | 1,137.0 | 1,460.7 | 1,876.4 | 2,410.5 |
| Depreciation | ||||||||||
| Changes in Account Receivables | ||||||||||
| Changes in Inventories | ||||||||||
| Changes in Accounts Payable | ||||||||||
| Capital Expenditure | ||||||||||
| UFCF | -2,815.0 | 104.8 | -3,476.1 | 139.6 | 1,262.4 | -1,682.1 | -1,677.1 | -2,154.5 | -2,767.7 | -3,555.5 |
| WACC, % | 3.87 | 3.88 | 3.87 | 3.86 | 4.28 | 3.95 | 3.95 | 3.95 | 3.95 | 3.95 |
| PV UFCF | ||||||||||
| SUM PV UFCF | -10,387.6 | |||||||||
| Long Term Growth Rate, % | 3.50 | |||||||||
| Free cash flow (T + 1) | -3,680 | |||||||||
| Terminal Value | -814,295 | |||||||||
| Present Terminal Value | -670,841 | |||||||||
| Enterprise Value | -681,228 | |||||||||
| Net Debt | 3,740 | |||||||||
| Equity Value | -684,969 | |||||||||
| Diluted Shares Outstanding, MM | 423 | |||||||||
| Equity Value Per Share | -1,617.64 |
What You Will Receive
- Genuine Shanghai QiFan Data: Preloaded financial metrics – encompassing revenue to EBIT – based on real and projected statistics.
- Comprehensive Customization: Modify all essential parameters (yellow cells) such as WACC, growth %, and tax rates according to your needs.
- Immediate Valuation Updates: Automatic recalculations to assess the effects of alterations on Shanghai QiFan's fair value.
- Flexible Excel Template: Designed for quick modifications, scenario analysis, and in-depth projections.
- Efficient and Accurate: Eliminate the need to create models from the ground up while ensuring accuracy and adaptability.
Key Features
- Comprehensive DCF Calculator: Provides in-depth unlevered and levered DCF valuation frameworks for accurate assessments.
- WACC Calculator: Features a ready-to-use Weighted Average Cost of Capital template with adjustable parameters.
- Customizable Forecast Inputs: Adjust growth projections, capital investment, and discount rates as desired.
- Integrated Financial Ratios: Evaluate profitability, leverage, and operational efficiency ratios for Shanghai QiFan Cable Co., Ltd (605222SS).
- Visual Dashboard and Charts: Graphical representations provide a concise overview of essential valuation metrics for straightforward analysis.
How It Works
- Download: Obtain the pre-configured Excel file containing Shanghai QiFan Cable Co., Ltd's (605222SS) financial data.
- Customize: Modify forecasts such as revenue growth, EBITDA %, and WACC to suit your analysis.
- Update Automatically: Enjoy real-time updates for intrinsic value and NPV calculations as you adjust inputs.
- Test Scenarios: Generate various projections and quickly compare the results.
- Make Decisions: Leverage the valuation findings to inform your investment choices.
Why Opt for Our Cable Solutions?
- Reliability: Our products are built to meet rigorous industry standards, ensuring quality and performance.
- Versatility: Tailored to accommodate a wide range of applications across various sectors.
- Efficiency: Streamline your project timelines with our ready-to-use cable solutions.
- Industry Expertise: Backed by years of experience, we deliver solutions designed for modern demands.
- Accessibility: Designed with user experience in mind, making it easy for everyone to find their ideal product.
Who Can Benefit from This Product?
- Investors: Assess the valuation of Shanghai QiFan Cable Co., Ltd (605222SS) before making investment decisions.
- Finance Executives and Analysts: Optimize valuation workflows and evaluate financial forecasts.
- Entrepreneurs: Understand how established companies like Shanghai QiFan are valued in the market.
- Consultants: Create detailed valuation reports for your clients focused on the cable industry.
- Students and Educators: Utilize real-time data for practicing and teaching valuation methodologies.
Contents of the Template
- Pre-Filled DCF Model: Financial data for Shanghai QiFan Cable Co., Ltd (605222SS) preloaded for immediate analysis.
- WACC Calculator: Comprehensive calculations for Weighted Average Cost of Capital.
- Financial Ratios: Assess Shanghai QiFan Cable Co., Ltd (605222SS)’s profitability, leverage, and operational efficiency.
- Editable Inputs: Modify assumptions like growth rates, margins, and CAPEX to tailor scenarios to your needs.
- Financial Statements: Access annual and quarterly reports for thorough evaluation.
- Interactive Dashboard: Effortlessly visualize essential valuation metrics and outcomes.
Disclaimer
All information, articles, and product details provided on this website are for general informational and educational purposes only. We do not claim any ownership over, nor do we intend to infringe upon, any trademarks, copyrights, logos, brand names, or other intellectual property mentioned or depicted on this site. Such intellectual property remains the property of its respective owners, and any references here are made solely for identification or informational purposes, without implying any affiliation, endorsement, or partnership.
We make no representations or warranties, express or implied, regarding the accuracy, completeness, or suitability of any content or products presented. Nothing on this website should be construed as legal, tax, investment, financial, medical, or other professional advice. In addition, no part of this site—including articles or product references—constitutes a solicitation, recommendation, endorsement, advertisement, or offer to buy or sell any securities, franchises, or other financial instruments, particularly in jurisdictions where such activity would be unlawful.
All content is of a general nature and may not address the specific circumstances of any individual or entity. It is not a substitute for professional advice or services. Any actions you take based on the information provided here are strictly at your own risk. You accept full responsibility for any decisions or outcomes arising from your use of this website and agree to release us from any liability in connection with your use of, or reliance upon, the content or products found herein.