
|
Ficont Industry Co., Ltd. (605305.ss) Valoración de DCF |
Completamente Editable: Adáptelo A Sus Necesidades En Excel O Sheets
Diseño Profesional: Plantillas Confiables Y Estándares De La Industria
Predeterminadas Para Un Uso Rápido Y Eficiente
Compatible con MAC / PC, completamente desbloqueado
No Se Necesita Experiencia; Fáciles De Seguir
Ficont Industry (Beijing) Co., Ltd. (605305.SS) Bundle
Diseñada para la precisión, nuestra calculadora DCF (605305SS) le permite evaluar la industria de Ficont (Beijing) Co., Ltd. Valoración utilizando datos financieros del mundo real, al tiempo que ofrece una flexibilidad completa para modificar todos los parámetros clave para proyecciones más precisas.
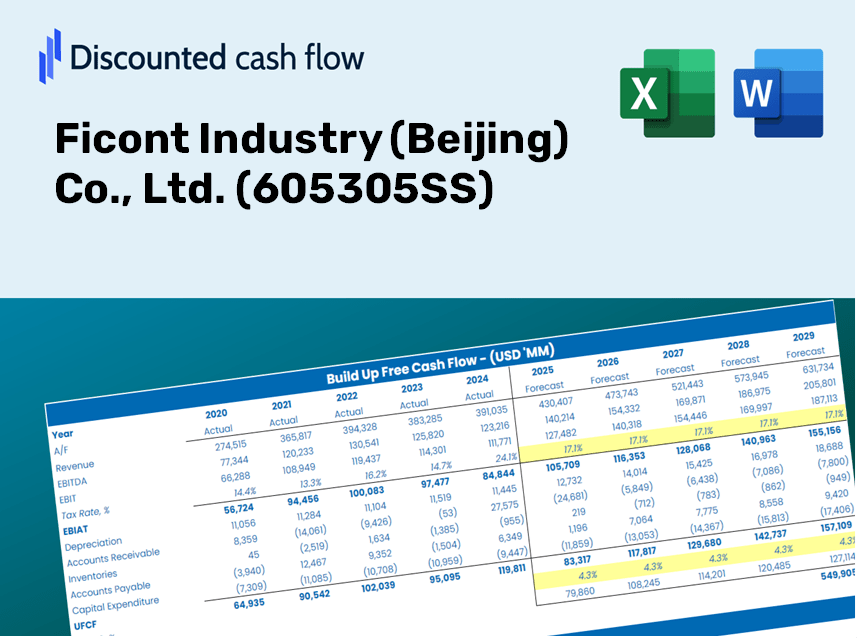
Discounted Cash Flow (DCF) - (USD MM)
| Year | AY1 2020 |
AY2 2021 |
AY3 2022 |
AY4 2023 |
AY5 2024 |
FY1 2025 |
FY2 2026 |
FY3 2027 |
FY4 2028 |
FY5 2029 |
|---|---|---|---|---|---|---|---|---|---|---|
| Revenue | 681.0 | 882.8 | 799.4 | 1,104.5 | 1,298.7 | 1,545.3 | 1,838.6 | 2,187.6 | 2,603.0 | 3,097.1 |
| Revenue Growth, % | 0 | 29.64 | -9.45 | 38.17 | 17.58 | 18.98 | 18.98 | 18.98 | 18.98 | 18.98 |
| EBITDA | 221.1 | 247.6 | 112.5 | 181.5 | 278.2 | 347.5 | 413.5 | 492.0 | 585.3 | 696.5 |
| EBITDA, % | 32.46 | 28.04 | 14.07 | 16.44 | 21.43 | 22.49 | 22.49 | 22.49 | 22.49 | 22.49 |
| Depreciation | 6.0 | 7.6 | 10.7 | 16.0 | 16.2 | 17.9 | 21.3 | 25.3 | 30.1 | 35.8 |
| Depreciation, % | 0.88591 | 0.8622 | 1.34 | 1.45 | 1.25 | 1.16 | 1.16 | 1.16 | 1.16 | 1.16 |
| EBIT | 215.1 | 240.0 | 101.8 | 165.5 | 262.1 | 329.6 | 392.2 | 466.7 | 555.2 | 660.7 |
| EBIT, % | 31.58 | 27.18 | 12.73 | 14.99 | 20.18 | 21.33 | 21.33 | 21.33 | 21.33 | 21.33 |
| Total Cash | 564.2 | 1,590.5 | 1,618.0 | 1,672.2 | 1,914.3 | 1,492.3 | 1,775.6 | 2,112.6 | 2,513.7 | 2,990.9 |
| Total Cash, percent | .0 | .0 | .0 | .0 | .0 | .0 | .0 | .0 | .0 | .0 |
| Account Receivables | 374.5 | 500.8 | 420.2 | 602.0 | 611.3 | 821.6 | 977.6 | 1,163.2 | 1,384.0 | 1,646.8 |
| Account Receivables, % | 54.99 | 56.72 | 52.57 | 54.51 | 47.07 | 53.17 | 53.17 | 53.17 | 53.17 | 53.17 |
| Inventories | 177.0 | 178.8 | 185.3 | 236.1 | 390.5 | 373.5 | 444.4 | 528.8 | 629.2 | 748.7 |
| Inventories, % | 25.99 | 20.25 | 23.18 | 21.38 | 30.07 | 24.17 | 24.17 | 24.17 | 24.17 | 24.17 |
| Accounts Payable | 105.0 | 184.6 | 147.4 | 305.7 | 112.7 | 281.6 | 335.1 | 398.7 | 474.4 | 564.4 |
| Accounts Payable, % | 15.42 | 20.91 | 18.45 | 27.68 | 8.68 | 18.23 | 18.23 | 18.23 | 18.23 | 18.23 |
| Capital Expenditure | -10.4 | -10.0 | -190.4 | -23.8 | -38.0 | -97.6 | -116.1 | -138.1 | -164.4 | -195.6 |
| Capital Expenditure, % | -1.53 | -1.14 | -23.82 | -2.15 | -2.93 | -6.31 | -6.31 | -6.31 | -6.31 | -6.31 |
| Tax Rate, % | 9.86 | 9.86 | 9.86 | 9.86 | 9.86 | 9.86 | 9.86 | 9.86 | 9.86 | 9.86 |
| EBITAT | 187.7 | 210.3 | 92.0 | 147.0 | 236.2 | 292.9 | 348.5 | 414.6 | 493.3 | 587.0 |
| Depreciation | ||||||||||
| Changes in Account Receivables | ||||||||||
| Changes in Inventories | ||||||||||
| Changes in Accounts Payable | ||||||||||
| Capital Expenditure | ||||||||||
| UFCF | -263.2 | 159.3 | -50.8 | 64.8 | -142.2 | 188.7 | 80.2 | 95.4 | 113.6 | 135.1 |
| WACC, % | 6.58 | 6.58 | 6.58 | 6.58 | 6.58 | 6.58 | 6.58 | 6.58 | 6.58 | 6.58 |
| PV UFCF | ||||||||||
| SUM PV UFCF | 512.8 | |||||||||
| Long Term Growth Rate, % | 3.50 | |||||||||
| Free cash flow (T + 1) | 140 | |||||||||
| Terminal Value | 4,541 | |||||||||
| Present Terminal Value | 3,302 | |||||||||
| Enterprise Value | 3,815 | |||||||||
| Net Debt | -900 | |||||||||
| Equity Value | 4,715 | |||||||||
| Diluted Shares Outstanding, MM | 213 | |||||||||
| Equity Value Per Share | 22.17 |
What You Will Receive
- Genuine Ficont Data: Preloaded financials – from revenue to EBIT – derived from actual and forecasted figures.
- Comprehensive Customization: Adjust all key parameters (yellow cells) such as WACC, growth %, and tax rates.
- Immediate Valuation Updates: Automatic recalculations to assess the impact of changes on Ficont's fair value.
- Flexible Excel Template: Designed for quick modifications, scenario analysis, and detailed projections.
- Efficient and Precise: Eliminate the need to build models from scratch while ensuring accuracy and adaptability.
Key Features
- Customizable Forecast Inputs: Adjust essential variables such as revenue growth, EBITDA percentage, and capital expenditures.
- Instant DCF Valuation: Quickly generates intrinsic value, NPV, and various financial outputs.
- High Precision Analysis: Leverages Ficont Industry's actual financial data for dependable valuation results.
- Effortless Scenario Analysis: Easily explore different assumptions and evaluate their impacts.
- Efficiency-Boosting Tool: Streamline your process by avoiding the need to create intricate valuation models from ground up.
How It Operates
- Download the Template: Gain immediate access to the Excel-based Ficont Industry DCF Calculator.
- Input Your Assumptions: Modify the yellow-highlighted cells for growth rates, WACC, margins, and additional variables.
- Instant Calculations: The model automatically calculates the intrinsic value of Ficont Industry ([605305SS]).
- Test Scenarios: Experiment with different assumptions to assess potential changes in valuation.
- Analyze and Decide: Utilize the results to inform your investment or financial analysis.
Why Choose Ficont Industry (Beijing) Co., Ltd. (605305SS) Calculator?
- All-in-One Solution: Combines DCF, WACC, and comprehensive financial ratio analyses in a single tool.
- Adjustable Parameters: Modify the highlighted cells to explore different financial scenarios.
- In-Depth Analysis: Automatically computes the intrinsic value and Net Present Value for Ficont Industry.
- Loaded with Data: Contains both historical and projected data for reliable analysis.
- High Professional Standards: Perfect for financial analysts, investors, and business consultants.
Who Can Benefit from Ficont Industry (Beijing) Co., Ltd. (605305SS)?
- Individual Investors: Equip yourself with the knowledge needed to make strategic investment decisions regarding Ficont Industry (605305SS).
- Financial Analysts: Enhance your valuation processes using comprehensive financial models tailored for Ficont Industry.
- Consultants: Provide clients with accurate and timely valuation insights for Ficont Industry (605305SS).
- Business Owners: Gain insights into the valuation of prominent companies like Ficont Industry to inform your own business strategies.
- Finance Students: Explore practical valuation methodologies with real-time data and case studies related to Ficont Industry (605305SS).
Contents of the Template
- Pre-Filled DCF Model: Ficont Industry's financial data preloaded for immediate utilization.
- WACC Calculator: Comprehensive calculations for Weighted Average Cost of Capital.
- Financial Ratios: Assess Ficont Industry's profitability, leverage, and operational efficiency.
- Editable Inputs: Modify assumptions such as growth rates, profit margins, and capital expenditures to tailor your scenarios.
- Financial Statements: Annual and quarterly reports provided for in-depth analysis.
- Interactive Dashboard: Effortlessly visualize essential valuation metrics and outcomes.
Disclaimer
All information, articles, and product details provided on this website are for general informational and educational purposes only. We do not claim any ownership over, nor do we intend to infringe upon, any trademarks, copyrights, logos, brand names, or other intellectual property mentioned or depicted on this site. Such intellectual property remains the property of its respective owners, and any references here are made solely for identification or informational purposes, without implying any affiliation, endorsement, or partnership.
We make no representations or warranties, express or implied, regarding the accuracy, completeness, or suitability of any content or products presented. Nothing on this website should be construed as legal, tax, investment, financial, medical, or other professional advice. In addition, no part of this site—including articles or product references—constitutes a solicitation, recommendation, endorsement, advertisement, or offer to buy or sell any securities, franchises, or other financial instruments, particularly in jurisdictions where such activity would be unlawful.
All content is of a general nature and may not address the specific circumstances of any individual or entity. It is not a substitute for professional advice or services. Any actions you take based on the information provided here are strictly at your own risk. You accept full responsibility for any decisions or outcomes arising from your use of this website and agree to release us from any liability in connection with your use of, or reliance upon, the content or products found herein.