
|
Beijing Caishikou Department Store Co., Ltd. (605599.ss) Valoración de DCF |
Completamente Editable: Adáptelo A Sus Necesidades En Excel O Sheets
Diseño Profesional: Plantillas Confiables Y Estándares De La Industria
Predeterminadas Para Un Uso Rápido Y Eficiente
Compatible con MAC / PC, completamente desbloqueado
No Se Necesita Experiencia; Fáciles De Seguir
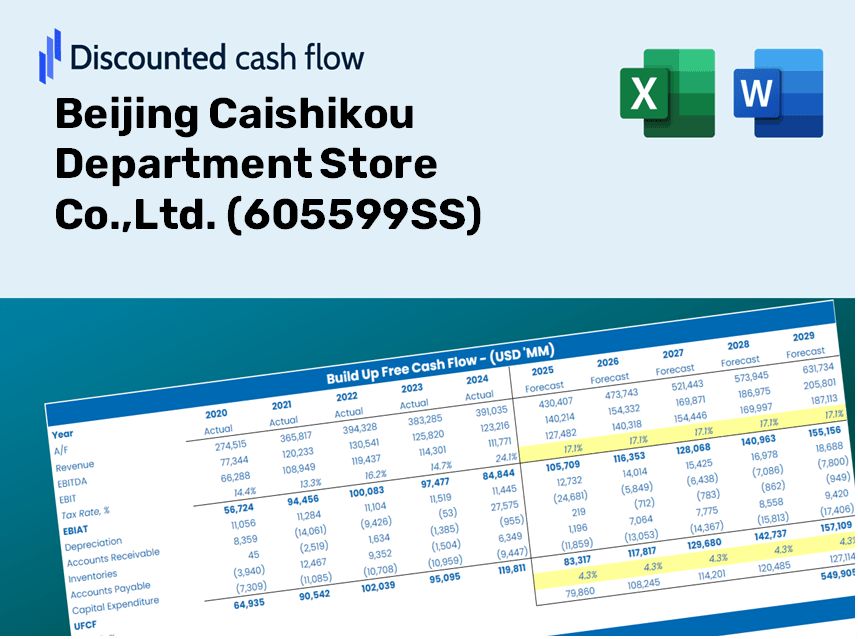
Beijing Caishikou Department Store Co.,Ltd. (605599.SS) Bundle
Ingementada para su precisión, nuestra calculadora DCF (605599SS) le permite evaluar la valoración de Beijing Caishikuko Department Store Co., Ltd. utilizando datos financieros reales y ofrece una flexibilidad completa para modificar todos los parámetros esenciales para mejoras mejoras.
Discounted Cash Flow (DCF) - (USD MM)
| Year | AY1 2020 |
AY2 2021 |
AY3 2022 |
AY4 2023 |
AY5 2024 |
FY1 2025 |
FY2 2026 |
FY3 2027 |
FY4 2028 |
FY5 2029 |
|---|---|---|---|---|---|---|---|---|---|---|
| Revenue | 7,067.9 | 10,405.8 | 10,989.9 | 16,552.2 | 20,232.7 | 26,590.2 | 34,945.4 | 45,926.0 | 60,357.0 | 79,322.4 |
| Revenue Growth, % | 0 | 47.23 | 5.61 | 50.61 | 22.24 | 31.42 | 31.42 | 31.42 | 31.42 | 31.42 |
| EBITDA | 514.9 | 555.4 | 605.7 | 940.8 | 985.6 | 1,525.7 | 2,005.1 | 2,635.2 | 3,463.2 | 4,551.5 |
| EBITDA, % | 7.29 | 5.34 | 5.51 | 5.68 | 4.87 | 5.74 | 5.74 | 5.74 | 5.74 | 5.74 |
| Depreciation | 16.4 | 19.5 | 20.2 | 22.3 | 14.4 | 43.0 | 56.6 | 74.3 | 97.7 | 128.4 |
| Depreciation, % | 0.23221 | 0.18739 | 0.18376 | 0.13478 | 0.07107444 | 0.16184 | 0.16184 | 0.16184 | 0.16184 | 0.16184 |
| EBIT | 498.5 | 536.0 | 585.5 | 918.5 | 971.2 | 1,482.7 | 1,948.6 | 2,560.9 | 3,365.6 | 4,423.1 |
| EBIT, % | 7.05 | 5.15 | 5.33 | 5.55 | 4.8 | 5.58 | 5.58 | 5.58 | 5.58 | 5.58 |
| Total Cash | 1,213.4 | 1,594.8 | 1,855.4 | 2,135.2 | 1,966.3 | 3,828.7 | 5,031.8 | 6,612.8 | 8,690.7 | 11,421.6 |
| Total Cash, percent | .0 | .0 | .0 | .0 | .0 | .0 | .0 | .0 | .0 | .0 |
| Account Receivables | 128.7 | 178.3 | 252.9 | 625.0 | 305.7 | 591.5 | 777.4 | 1,021.7 | 1,342.7 | 1,764.6 |
| Account Receivables, % | 1.82 | 1.71 | 2.3 | 3.78 | 1.51 | 2.22 | 2.22 | 2.22 | 2.22 | 2.22 |
| Inventories | 1,706.9 | 2,740.3 | 2,716.4 | 3,233.1 | 3,947.3 | 6,075.5 | 7,984.6 | 10,493.5 | 13,790.8 | 18,124.2 |
| Inventories, % | 24.15 | 26.33 | 24.72 | 19.53 | 19.51 | 22.85 | 22.85 | 22.85 | 22.85 | 22.85 |
| Accounts Payable | 94.4 | 117.9 | 68.4 | 79.0 | 90.4 | 213.6 | 280.7 | 368.9 | 484.8 | 637.1 |
| Accounts Payable, % | 1.34 | 1.13 | 0.62267 | 0.47732 | 0.44669 | 0.80323 | 0.80323 | 0.80323 | 0.80323 | 0.80323 |
| Capital Expenditure | -48.2 | -36.9 | -48.1 | -32.7 | -40.5 | -99.6 | -130.9 | -172.0 | -226.1 | -297.2 |
| Capital Expenditure, % | -0.68236 | -0.35487 | -0.43762 | -0.19781 | -0.20041 | -0.37461 | -0.37461 | -0.37461 | -0.37461 | -0.37461 |
| Tax Rate, % | 25.81 | 25.81 | 25.81 | 25.81 | 25.81 | 25.81 | 25.81 | 25.81 | 25.81 | 25.81 |
| EBITAT | 364.8 | 389.1 | 436.8 | 682.0 | 720.6 | 1,093.7 | 1,437.4 | 1,889.0 | 2,482.6 | 3,262.7 |
| Depreciation | ||||||||||
| Changes in Account Receivables | ||||||||||
| Changes in Inventories | ||||||||||
| Changes in Accounts Payable | ||||||||||
| Capital Expenditure | ||||||||||
| UFCF | -1,408.2 | -687.9 | 308.7 | -206.5 | 310.9 | -1,253.8 | -664.8 | -873.7 | -1,148.2 | -1,509.0 |
| WACC, % | 6.61 | 6.6 | 6.61 | 6.61 | 6.61 | 6.61 | 6.61 | 6.61 | 6.61 | 6.61 |
| PV UFCF | ||||||||||
| SUM PV UFCF | -4,466.6 | |||||||||
| Long Term Growth Rate, % | 3.50 | |||||||||
| Free cash flow (T + 1) | -1,562 | |||||||||
| Terminal Value | -50,212 | |||||||||
| Present Terminal Value | -36,459 | |||||||||
| Enterprise Value | -40,926 | |||||||||
| Net Debt | -1,315 | |||||||||
| Equity Value | -39,611 | |||||||||
| Diluted Shares Outstanding, MM | 782 | |||||||||
| Equity Value Per Share | -50.68 |
What You Will Receive
- Adjustable Forecast Inputs: Easily modify assumptions (growth %, profit margins, discount rates) to generate various scenarios.
- Relevant Financial Data: Pre-filled financial information for Beijing Caishikou Department Store Co., Ltd. (605599SS) to kickstart your analysis.
- Automated DCF Calculations: The template computes Net Present Value (NPV) and intrinsic value automatically.
- Customizable and Professional Design: A sophisticated Excel model tailored to meet your valuation requirements.
- Designed for Analysts and Investors: Perfect for evaluating projections, verifying strategies, and enhancing efficiency.
Key Features
- Accurate Financial Insights: Gain access to reliable pre-loaded historical data and future forecasts for Beijing Caishikou Department Store Co., Ltd. (605599SS).
- Adjustable Forecast Parameters: Modify highlighted cells for metrics such as WACC, growth rates, and margins to suit your analysis.
- Real-Time Calculations: Automatic updates for DCF, Net Present Value (NPV), and cash flow assessments.
- User-Friendly Dashboard: Clear and engaging charts and summaries for easy interpretation of your valuation outcomes.
- Designed for All Skill Levels: A straightforward, intuitive layout crafted for investors, CFOs, and consultants alike.
How It Functions
- 1. Access the Template: Download the Excel file featuring Beijing Caishikou Department Store Co., Ltd.'s preloaded data ([605599SS]).
- 2. Adjust Assumptions: Modify essential inputs such as growth rates, WACC, and capital expenditures.
- 3. See Immediate Results: The DCF model will automatically compute the intrinsic value and NPV.
- 4. Evaluate Scenarios: Analyze various forecasts to compare different valuation results.
- 5. Present with Assurance: Deliver professional valuation insights to reinforce your decision-making.
Why Opt for This Financial Calculator?
- All-in-One Solution: Combines DCF, WACC, and key financial ratio analyses in a single tool.
- Flexible Inputs: Modify the highlighted cells to explore different financial scenarios.
- In-Depth Analysis: Automatically computes the intrinsic value and Net Present Value for Beijing Caishikou Department Store Co., Ltd. (605599SS).
- Preloaded Information: Comes with historical data and projections to provide reliable starting points.
- Professional Standard: Perfect for financial analysts, investors, and consultants in the retail sector.
Who Should Use This Product?
- Investors: Accurately assess the fair value of Beijing Caishikou Department Store Co., Ltd. (605599SS) before making investment choices.
- CFOs: Utilize a high-quality DCF model for financial reporting and analysis tailored to this company.
- Consultants: Efficiently customize the template for valuation reports catered to clients in retail.
- Entrepreneurs: Discover insights into financial modeling practices employed by leading retail companies.
- Educators: Implement it as a resource to illustrate valuation methodologies in a classroom setting.
Contents of the Template
- Detailed DCF Model: An editable template featuring thorough valuation calculations tailored for Beijing Caishikou Department Store Co., Ltd. (605599SS).
- Historical & Projected Data: Preloaded financial information regarding Beijing Caishikou's past and future performance for insightful analysis.
- Adjustable Parameters: Modify WACC, growth rates, and tax assumptions to explore various scenarios.
- Comprehensive Financial Statements: Annual and quarterly reports provided for an in-depth understanding.
- Essential Ratios: Integrated analyses covering profitability, efficiency, and leverage metrics.
- Interactive Dashboard with Visual Outputs: Includes charts and tables that present clear and actionable results.
Disclaimer
All information, articles, and product details provided on this website are for general informational and educational purposes only. We do not claim any ownership over, nor do we intend to infringe upon, any trademarks, copyrights, logos, brand names, or other intellectual property mentioned or depicted on this site. Such intellectual property remains the property of its respective owners, and any references here are made solely for identification or informational purposes, without implying any affiliation, endorsement, or partnership.
We make no representations or warranties, express or implied, regarding the accuracy, completeness, or suitability of any content or products presented. Nothing on this website should be construed as legal, tax, investment, financial, medical, or other professional advice. In addition, no part of this site—including articles or product references—constitutes a solicitation, recommendation, endorsement, advertisement, or offer to buy or sell any securities, franchises, or other financial instruments, particularly in jurisdictions where such activity would be unlawful.
All content is of a general nature and may not address the specific circumstances of any individual or entity. It is not a substitute for professional advice or services. Any actions you take based on the information provided here are strictly at your own risk. You accept full responsibility for any decisions or outcomes arising from your use of this website and agree to release us from any liability in connection with your use of, or reliance upon, the content or products found herein.