
|
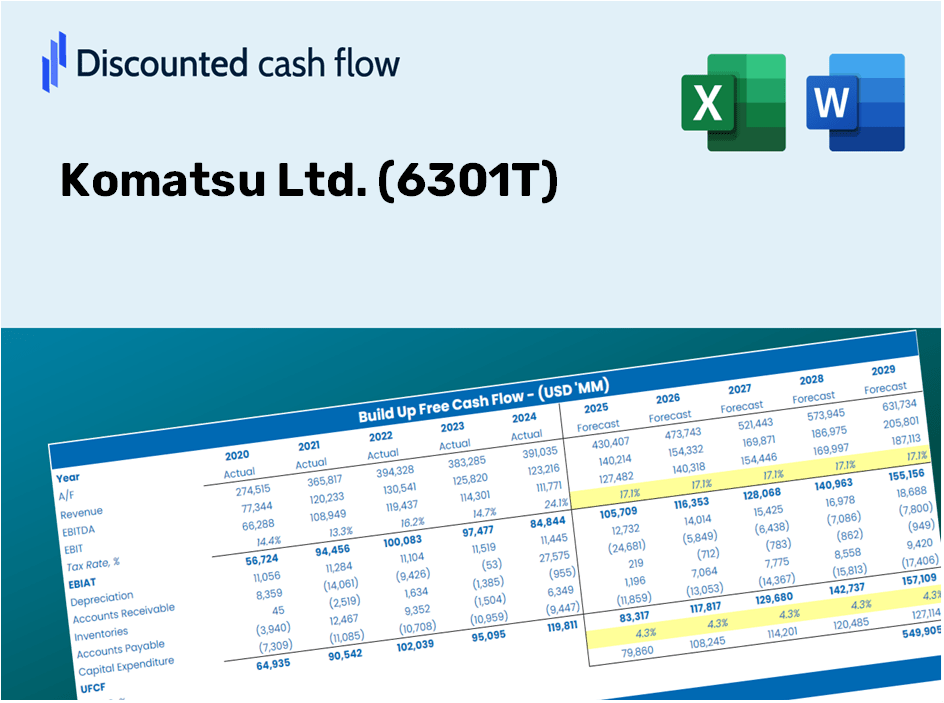
Komatsu Ltd. (6301.T) Valoración de DCF |
Completamente Editable: Adáptelo A Sus Necesidades En Excel O Sheets
Diseño Profesional: Plantillas Confiables Y Estándares De La Industria
Predeterminadas Para Un Uso Rápido Y Eficiente
Compatible con MAC / PC, completamente desbloqueado
No Se Necesita Experiencia; Fáciles De Seguir
Komatsu Ltd. (6301.T) Bundle
Ingementista para su precisión, nuestra calculadora DCF (6301T) le permite evaluar la valoración de Komatsu Ltd. utilizando datos financieros del mundo real, al tiempo que ofrece una flexibilidad completa para modificar todos los parámetros esenciales para mejorar las proyecciones.
Discounted Cash Flow (DCF) - (USD MM)
| Year | AY1 2021 |
AY2 2022 |
AY3 2023 |
AY4 2024 |
AY5 2025 |
FY1 2026 |
FY2 2027 |
FY3 2028 |
FY4 2029 |
FY5 2030 |
|---|---|---|---|---|---|---|---|---|---|---|
| Revenue | 2,189,512.0 | 2,802,323.0 | 3,543,475.0 | 3,865,122.0 | 4,104,395.0 | 4,819,626.6 | 5,659,494.5 | 6,645,717.7 | 7,803,800.1 | 9,163,689.8 |
| Revenue Growth, % | 0 | 27.99 | 26.45 | 9.08 | 6.19 | 17.43 | 17.43 | 17.43 | 17.43 | 17.43 |
| EBITDA | 309,667.0 | 473,136.0 | 658,493.0 | 787,009.0 | 825,436.0 | 868,332.9 | 1,019,648.5 | 1,197,332.4 | 1,405,979.5 | 1,650,985.4 |
| EBITDA, % | 14.14 | 16.88 | 18.58 | 20.36 | 20.11 | 18.02 | 18.02 | 18.02 | 18.02 | 18.02 |
| Depreciation | 133,126.0 | 136,346.0 | 149,688.0 | 156,835.0 | 163,004.0 | 223,622.1 | 262,590.4 | 308,349.4 | 362,082.4 | 425,178.9 |
| Depreciation, % | 6.08 | 4.87 | 4.22 | 4.06 | 3.97 | 4.64 | 4.64 | 4.64 | 4.64 | 4.64 |
| EBIT | 176,541.0 | 336,790.0 | 508,805.0 | 630,174.0 | 662,432.0 | 644,710.8 | 757,058.1 | 888,983.0 | 1,043,897.1 | 1,225,806.5 |
| EBIT, % | 8.06 | 12.02 | 14.36 | 16.3 | 16.14 | 13.38 | 13.38 | 13.38 | 13.38 | 13.38 |
| Total Cash | 243,127.0 | 316,670.0 | 289,975.0 | 403,178.0 | 385,569.0 | 485,943.9 | 570,624.4 | 670,061.4 | 786,826.2 | 923,938.5 |
| Total Cash, percent | .0 | .0 | .0 | .0 | .0 | .0 | .0 | .0 | .0 | .0 |
| Account Receivables | 822,218.0 | 956,369.0 | 1,114,392.0 | 1,263,542.0 | 1,274,209.0 | 1,608,456.7 | 1,888,746.2 | 2,217,879.1 | 2,604,366.5 | 3,058,203.3 |
| Account Receivables, % | 37.55 | 34.13 | 31.45 | 32.69 | 31.04 | 33.37 | 33.37 | 33.37 | 33.37 | 33.37 |
| Inventories | 793,852.0 | 988,011.0 | 1,227,208.0 | 1,438,695.0 | 1,406,658.0 | 1,712,329.2 | 2,010,719.6 | 2,361,107.5 | 2,772,554.0 | 3,255,699.1 |
| Inventories, % | 36.26 | 35.26 | 34.63 | 37.22 | 34.27 | 35.53 | 35.53 | 35.53 | 35.53 | 35.53 |
| Accounts Payable | 258,316.0 | 338,974.0 | 362,360.0 | 320,312.0 | 334,929.0 | 487,434.6 | 572,374.9 | 672,117.0 | 789,240.0 | 926,772.9 |
| Accounts Payable, % | 11.8 | 12.1 | 10.23 | 8.29 | 8.16 | 10.11 | 10.11 | 10.11 | 10.11 | 10.11 |
| Capital Expenditure | -181,548.0 | -162,956.0 | -183,533.0 | -202,947.0 | -205,855.0 | -284,863.2 | -334,503.4 | -392,794.0 | -461,242.2 | -541,618.3 |
| Capital Expenditure, % | -8.29 | -5.82 | -5.18 | -5.25 | -5.02 | -5.91 | -5.91 | -5.91 | -5.91 | -5.91 |
| Tax Rate, % | 27.38 | 27.38 | 27.38 | 27.38 | 27.38 | 27.38 | 27.38 | 27.38 | 27.38 | 27.38 |
| EBITAT | 113,300.4 | 229,676.1 | 344,747.1 | 424,578.8 | 481,082.9 | 438,569.0 | 514,994.0 | 604,736.8 | 710,118.2 | 833,863.3 |
| Depreciation | ||||||||||
| Changes in Account Receivables | ||||||||||
| Changes in Inventories | ||||||||||
| Changes in Accounts Payable | ||||||||||
| Capital Expenditure | ||||||||||
| UFCF | -1,292,875.6 | -44,585.9 | -62,931.9 | -24,218.2 | 474,218.9 | -110,085.5 | -50,658.7 | -59,486.4 | -69,852.5 | -82,025.0 |
| WACC, % | 6.08 | 6.12 | 6.12 | 6.11 | 6.16 | 6.12 | 6.12 | 6.12 | 6.12 | 6.12 |
| PV UFCF | ||||||||||
| SUM PV UFCF | -314,523.0 | |||||||||
| Long Term Growth Rate, % | 2.00 | |||||||||
| Free cash flow (T + 1) | -83,666 | |||||||||
| Terminal Value | -2,030,558 | |||||||||
| Present Terminal Value | -1,508,769 | |||||||||
| Enterprise Value | -1,823,292 | |||||||||
| Net Debt | 835,133 | |||||||||
| Equity Value | -2,658,425 | |||||||||
| Diluted Shares Outstanding, MM | 928 | |||||||||
| Equity Value Per Share | -2,865.29 |
What You Will Receive
- Authentic 6301T Financials: Features both historical and projected data for precise valuation.
- Customizable Inputs: Adjust WACC, tax rates, revenue growth, and capital expenditures to fit your analysis.
- Automated Calculations: Intrinsic value and NPV are calculated in real-time.
- Scenario Analysis: Explore various scenarios to assess Komatsu's future performance.
- User-Friendly Design: Crafted for industry professionals while remaining approachable for newcomers.
Key Features
- Customizable Forecast Inputs: Adjust essential parameters like equipment sales growth, operating margin, and capital investments.
- Instant DCF Valuation: Quickly computes intrinsic value, net present value, and other essential metrics.
- High-Precision Accuracy: Leverages Komatsu Ltd.'s (6301T) real financial data for realistic valuation results.
- Simplified Scenario Testing: Easily explore various assumptions and evaluate different scenarios.
- Efficiency Tool: Streamlines the valuation process, removing the need for intricate model development from the ground up.
How It Works
- Download: Obtain the user-friendly Excel file containing Komatsu Ltd.'s (6301T) financial data.
- Customize: Modify projections, including revenue growth, EBITDA %, and WACC.
- Update Automatically: Watch as intrinsic value and NPV calculations refresh in real-time.
- Test Scenarios: Generate various forecasts and instantly compare the results.
- Make Decisions: Leverage the valuation insights to inform your investment strategy.
Why Opt for This Calculator?
- Designed for Experts: A sophisticated tool utilized by financial analysts, CFOs, and consultants.
- Actual Data Included: Komatsu Ltd.'s historical and projected financials are preloaded for enhanced precision.
- Scenario Analysis: Effortlessly simulate various forecasts and assumptions.
- Clear Results: Automatically computes intrinsic value, NPV, and essential metrics.
- User-Friendly: Comprehensive step-by-step instructions to assist you throughout the process.
Who Can Benefit from This Product?
- Individual Investors: Make educated choices regarding the purchase or sale of Komatsu Ltd. (6301T) stock.
- Financial Analysts: Enhance valuation workflows with comprehensive financial models tailored for Komatsu Ltd. (6301T).
- Consultants: Provide clients with precise valuation insights on Komatsu Ltd. (6301T) in a timely manner.
- Business Owners: Gain insights into how major corporations like Komatsu Ltd. (6301T) are valued to inform your own strategic decisions.
- Finance Students: Master valuation methods using real-world examples and data related to Komatsu Ltd. (6301T).
Components of the Template
- Pre-Filled DCF Model: Komatsu Ltd.'s financial data preloaded for immediate utilization.
- WACC Calculator: Comprehensive calculations for the Weighted Average Cost of Capital.
- Financial Ratios: Assess Komatsu Ltd.'s profitability, leverage, and operational efficiency.
- Editable Inputs: Modify assumptions such as growth rates, margins, and CAPEX to align with your specific scenarios.
- Financial Statements: Annual and quarterly reports to facilitate detailed analysis.
- Interactive Dashboard: Visualize essential valuation metrics and outcomes with ease.
Disclaimer
All information, articles, and product details provided on this website are for general informational and educational purposes only. We do not claim any ownership over, nor do we intend to infringe upon, any trademarks, copyrights, logos, brand names, or other intellectual property mentioned or depicted on this site. Such intellectual property remains the property of its respective owners, and any references here are made solely for identification or informational purposes, without implying any affiliation, endorsement, or partnership.
We make no representations or warranties, express or implied, regarding the accuracy, completeness, or suitability of any content or products presented. Nothing on this website should be construed as legal, tax, investment, financial, medical, or other professional advice. In addition, no part of this site—including articles or product references—constitutes a solicitation, recommendation, endorsement, advertisement, or offer to buy or sell any securities, franchises, or other financial instruments, particularly in jurisdictions where such activity would be unlawful.
All content is of a general nature and may not address the specific circumstances of any individual or entity. It is not a substitute for professional advice or services. Any actions you take based on the information provided here are strictly at your own risk. You accept full responsibility for any decisions or outcomes arising from your use of this website and agree to release us from any liability in connection with your use of, or reliance upon, the content or products found herein.