
|
Hitachi Construction Machinery Co., Ltd. (6305.T) Valoración de DCF |
Completamente Editable: Adáptelo A Sus Necesidades En Excel O Sheets
Diseño Profesional: Plantillas Confiables Y Estándares De La Industria
Predeterminadas Para Un Uso Rápido Y Eficiente
Compatible con MAC / PC, completamente desbloqueado
No Se Necesita Experiencia; Fáciles De Seguir
Hitachi Construction Machinery Co., Ltd. (6305.T) Bundle
¡Explore las perspectivas financieras de Hitachi Construction Machinery Co., Ltd. (6305t) con nuestra calculadora DCF fácil de usar! Ingrese sus proyecciones para el crecimiento, los márgenes y los gastos para determinar el valor intrínseco de Hitachi Construction Machinery Co., Ltd. (6305T) y refinar su enfoque de inversión.
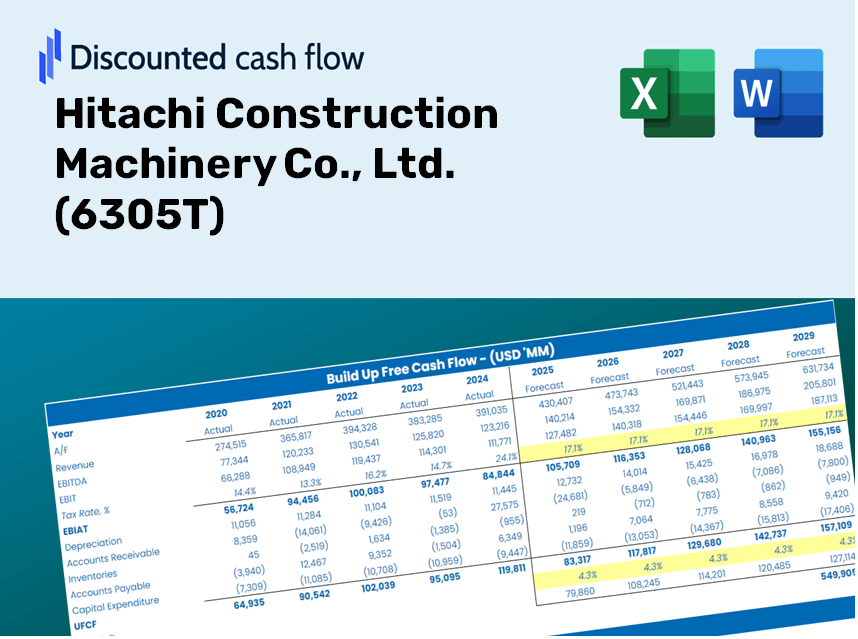
Discounted Cash Flow (DCF) - (USD MM)
| Year | AY1 2021 |
AY2 2022 |
AY3 2023 |
AY4 2024 |
AY5 2025 |
FY1 2026 |
FY2 2027 |
FY3 2028 |
FY4 2029 |
FY5 2030 |
|---|---|---|---|---|---|---|---|---|---|---|
| Revenue | 813,331.0 | 1,024,961.0 | 1,264,927.0 | 1,405,928.0 | 1,371,285.0 | 1,570,516.5 | 1,798,693.9 | 2,060,022.9 | 2,359,319.8 | 2,702,101.1 |
| Revenue Growth, % | 0 | 26.02 | 23.41 | 11.15 | -2.46 | 14.53 | 14.53 | 14.53 | 14.53 | 14.53 |
| EBITDA | 83,814.0 | 165,147.0 | 192,795.0 | 240,486.0 | 238,012.0 | 239,099.0 | 273,837.3 | 313,622.6 | 359,188.2 | 411,374.0 |
| EBITDA, % | 10.31 | 16.11 | 15.24 | 17.11 | 17.36 | 15.22 | 15.22 | 15.22 | 15.22 | 15.22 |
| Depreciation | 50,177.0 | 55,480.0 | 62,886.0 | 68,121.0 | 73,847.0 | 84,130.2 | 96,353.3 | 110,352.3 | 126,385.1 | 144,747.4 |
| Depreciation, % | 6.17 | 5.41 | 4.97 | 4.85 | 5.39 | 5.36 | 5.36 | 5.36 | 5.36 | 5.36 |
| EBIT | 33,637.0 | 109,667.0 | 129,909.0 | 172,365.0 | 164,165.0 | 154,968.8 | 177,484.0 | 203,270.3 | 232,803.1 | 266,626.6 |
| EBIT, % | 4.14 | 10.7 | 10.27 | 12.26 | 11.97 | 9.87 | 9.87 | 9.87 | 9.87 | 9.87 |
| Total Cash | 80,330.0 | 94,257.0 | 111,992.0 | 177,068.0 | 178,460.0 | 168,154.9 | 192,585.8 | 220,566.3 | 252,612.0 | 289,313.5 |
| Total Cash, percent | .0 | .0 | .0 | .0 | .0 | .0 | .0 | .0 | .0 | .0 |
| Account Receivables | 206,371.0 | 261,448.0 | 305,317.0 | 305,731.0 | 270,882.0 | 365,988.5 | 419,162.3 | 480,061.6 | 549,808.8 | 629,689.5 |
| Account Receivables, % | 25.37 | 25.51 | 24.14 | 21.75 | 19.75 | 23.3 | 23.3 | 23.3 | 23.3 | 23.3 |
| Inventories | 297,766.0 | 368,267.0 | 450,782.0 | 552,319.0 | 531,183.0 | 584,856.2 | 669,828.9 | 767,147.1 | 878,604.5 | 1,006,255.4 |
| Inventories, % | 36.61 | 35.93 | 35.64 | 39.29 | 38.74 | 37.24 | 37.24 | 37.24 | 37.24 | 37.24 |
| Accounts Payable | 180,673.0 | 222,841.0 | 244,034.0 | 261,930.0 | 233,766.0 | 310,727.7 | 355,872.8 | 407,576.9 | 466,793.0 | 534,612.5 |
| Accounts Payable, % | 22.21 | 21.74 | 19.29 | 18.63 | 17.05 | 19.79 | 19.79 | 19.79 | 19.79 | 19.79 |
| Capital Expenditure | -33,204.0 | -34,540.0 | -59,140.0 | -55,603.0 | -45,074.0 | -60,840.6 | -69,680.0 | -79,803.7 | -91,398.2 | -104,677.3 |
| Capital Expenditure, % | -4.08 | -3.37 | -4.68 | -3.95 | -3.29 | -3.87 | -3.87 | -3.87 | -3.87 | -3.87 |
| Tax Rate, % | 39.31 | 39.31 | 39.31 | 39.31 | 39.31 | 39.31 | 39.31 | 39.31 | 39.31 | 39.31 |
| EBITAT | 13,597.9 | 75,003.9 | 79,263.8 | 100,205.8 | 99,633.5 | 89,466.5 | 102,464.9 | 117,351.8 | 134,401.6 | 153,928.6 |
| Depreciation | ||||||||||
| Changes in Account Receivables | ||||||||||
| Changes in Inventories | ||||||||||
| Changes in Accounts Payable | ||||||||||
| Capital Expenditure | ||||||||||
| UFCF | -292,893.1 | 12,533.9 | -22,181.2 | 28,668.8 | 156,227.5 | 40,938.1 | 36,136.7 | 41,387.0 | 47,400.0 | 54,286.7 |
| WACC, % | 5.39 | 5.89 | 5.75 | 5.7 | 5.75 | 5.7 | 5.7 | 5.7 | 5.7 | 5.7 |
| PV UFCF | ||||||||||
| SUM PV UFCF | 185,265.3 | |||||||||
| Long Term Growth Rate, % | 3.00 | |||||||||
| Free cash flow (T + 1) | 55,915 | |||||||||
| Terminal Value | 2,074,675 | |||||||||
| Present Terminal Value | 1,572,805 | |||||||||
| Enterprise Value | 1,758,071 | |||||||||
| Net Debt | 463,287 | |||||||||
| Equity Value | 1,294,784 | |||||||||
| Diluted Shares Outstanding, MM | 213 | |||||||||
| Equity Value Per Share | 6,087.40 |
What You Will Receive
- Comprehensive (6305T) Financial Data: Pre-populated with Hitachi Construction Machinery’s historical and projected figures for detailed analysis.
- Customizable Template: Easily adjust key inputs such as revenue growth, WACC, and EBITDA percentage.
- Real-Time Calculations: Watch the intrinsic value of (6305T) update immediately based on your modifications.
- Professional Valuation Tool: Tailored for investors, analysts, and consultants seeking precise DCF results.
- User-Friendly Interface: Intuitive layout and straightforward instructions suitable for all skill levels.
Key Features
- Authentic Hitachi Financial Data: Gain access to precise pre-loaded historical figures and future forecasts.
- Adjustable Forecast Parameters: Modify the yellow-highlighted cells for metrics like WACC, growth rates, and profit margins.
- Automated Calculations: Instant updates to DCF, Net Present Value (NPV), and cash flow analyses.
- User-Friendly Dashboard: Clear charts and summaries for easy visualization of your valuation findings.
- Designed for All Levels: An intuitive layout suitable for investors, CFOs, and consultants alike.
How It Operates
- 1. Access the Template: Download and open the Excel file featuring Hitachi Construction Machinery Co., Ltd.'s preloaded data.
- 2. Modify Assumptions: Adjust key variables such as growth rates, WACC, and capital expenditures.
- 3. View Results Immediately: The DCF model automatically calculates intrinsic value and NPV.
- 4. Explore Different Scenarios: Analyze various projections to evaluate different valuation outcomes.
- 5. Utilize with Assurance: Deliver professional valuation insights to enhance your decision-making process.
Why Opt for Hitachi Construction Machinery Co., Ltd. (6305T) Calculator?
- Time Efficient: Skip the hassle of building a DCF model from the ground up – it's ready for immediate use.
- Enhanced Precision: Trusted financial data and formulas minimize valuation errors.
- Completely Customizable: Adjust the model to align with your specific assumptions and forecasts.
- User-Friendly: Intuitive charts and outputs simplify result interpretation.
- Expert Approved: Crafted for professionals who prioritize accuracy and functionality.
Who Can Benefit from This Product?
- Investors: Evaluate Hitachi Construction Machinery Co., Ltd. (6305T) before making stock transactions.
- CFOs and Financial Analysts: Optimize valuation procedures and assess future projections.
- Startup Founders: Gain insights into how established companies like Hitachi are valued.
- Consultants: Provide comprehensive valuation reports to clients.
- Students and Educators: Access real-world data to practice and instruct on valuation methods.
Contents of the Template
- Operating and Balance Sheet Data: Pre-filled historical data and forecasts for Hitachi Construction Machinery Co., Ltd. (6305T), including metrics such as revenue, EBITDA, EBIT, and capital expenditures.
- WACC Calculation: A dedicated sheet for computing the Weighted Average Cost of Capital (WACC), featuring parameters like Beta, risk-free rate, and share price.
- DCF Valuation (Unlevered and Levered): Customizable Discounted Cash Flow models that display intrinsic value along with comprehensive calculations.
- Financial Statements: Preloaded annual and quarterly financial statements to facilitate thorough analysis.
- Key Ratios: Includes key profitability, leverage, and efficiency ratios specific to Hitachi Construction Machinery Co., Ltd. (6305T).
- Dashboard and Charts: A visual summary of valuation outputs and assumptions, making it easy to analyze results.
Disclaimer
All information, articles, and product details provided on this website are for general informational and educational purposes only. We do not claim any ownership over, nor do we intend to infringe upon, any trademarks, copyrights, logos, brand names, or other intellectual property mentioned or depicted on this site. Such intellectual property remains the property of its respective owners, and any references here are made solely for identification or informational purposes, without implying any affiliation, endorsement, or partnership.
We make no representations or warranties, express or implied, regarding the accuracy, completeness, or suitability of any content or products presented. Nothing on this website should be construed as legal, tax, investment, financial, medical, or other professional advice. In addition, no part of this site—including articles or product references—constitutes a solicitation, recommendation, endorsement, advertisement, or offer to buy or sell any securities, franchises, or other financial instruments, particularly in jurisdictions where such activity would be unlawful.
All content is of a general nature and may not address the specific circumstances of any individual or entity. It is not a substitute for professional advice or services. Any actions you take based on the information provided here are strictly at your own risk. You accept full responsibility for any decisions or outcomes arising from your use of this website and agree to release us from any liability in connection with your use of, or reliance upon, the content or products found herein.