
|
Daikin Industries, Ltd. (6367.t) Valoración de DCF |
Completamente Editable: Adáptelo A Sus Necesidades En Excel O Sheets
Diseño Profesional: Plantillas Confiables Y Estándares De La Industria
Predeterminadas Para Un Uso Rápido Y Eficiente
Compatible con MAC / PC, completamente desbloqueado
No Se Necesita Experiencia; Fáciles De Seguir
Daikin Industries,Ltd. (6367.T) Bundle
Ya sea que sea un inversionista o analista, esta calculadora DCF (6367T) es su recurso de referencia para una valoración precisa. Cargados con datos reales de Daikin Industries, Ltd., puede ajustar los pronósticos e inmediatamente observar los efectos.
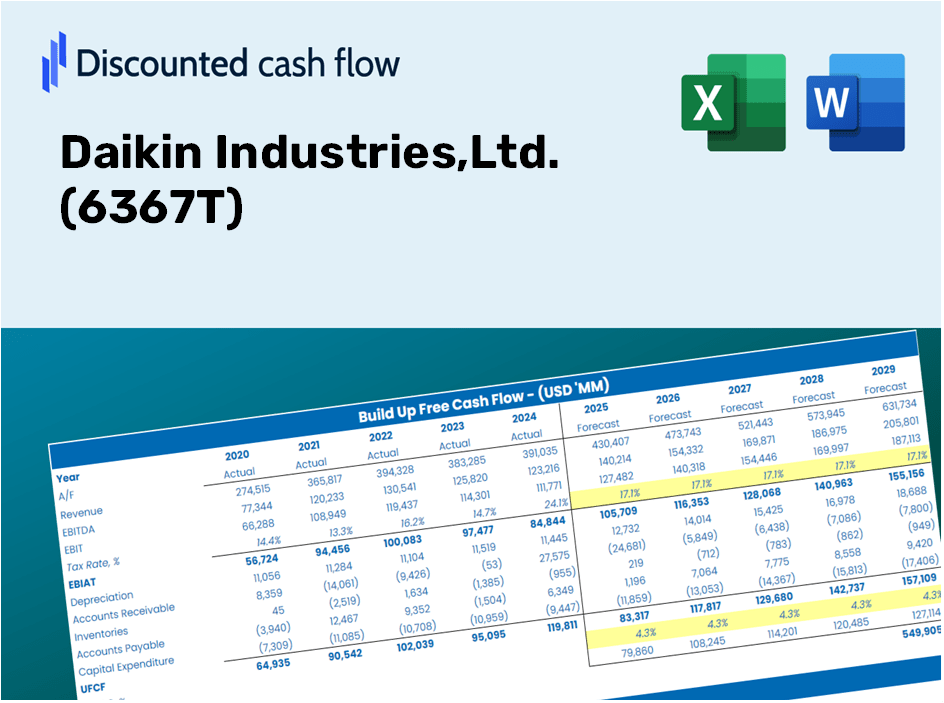
Discounted Cash Flow (DCF) - (USD MM)
| Year | AY1 2021 |
AY2 2022 |
AY3 2023 |
AY4 2024 |
AY5 2025 |
FY1 2026 |
FY2 2027 |
FY3 2028 |
FY4 2029 |
FY5 2030 |
|---|---|---|---|---|---|---|---|---|---|---|
| Revenue | 2,493,386.0 | 3,109,106.0 | 3,981,578.0 | 4,395,317.0 | 4,752,335.0 | 5,599,082.1 | 6,596,698.3 | 7,772,064.7 | 9,156,852.0 | 10,788,373.7 |
| Revenue Growth, % | 0 | 24.69 | 28.06 | 10.39 | 8.12 | 17.82 | 17.82 | 17.82 | 17.82 | 17.82 |
| EBITDA | 372,216.0 | 484,942.0 | 575,901.0 | 645,760.0 | 665,140.0 | 825,056.3 | 972,060.6 | 1,145,257.5 | 1,349,313.7 | 1,589,727.6 |
| EBITDA, % | 14.93 | 15.6 | 14.46 | 14.69 | 14 | 14.74 | 14.74 | 14.74 | 14.74 | 14.74 |
| Depreciation | 133,593.0 | 148,062.0 | 182,224.0 | 215,564.0 | 246,015.0 | 277,467.0 | 326,904.6 | 385,150.8 | 453,775.1 | 534,626.4 |
| Depreciation, % | 5.36 | 4.76 | 4.58 | 4.9 | 5.18 | 4.96 | 4.96 | 4.96 | 4.96 | 4.96 |
| EBIT | 238,623.0 | 336,880.0 | 393,677.0 | 430,196.0 | 419,125.0 | 547,589.3 | 645,156.0 | 760,106.6 | 895,538.6 | 1,055,101.2 |
| EBIT, % | 9.57 | 10.84 | 9.89 | 9.79 | 8.82 | 9.78 | 9.78 | 9.78 | 9.78 | 9.78 |
| Total Cash | 736,098.0 | 817,619.0 | 617,663.0 | 737,961.0 | 802,663.0 | 1,175,943.6 | 1,385,467.3 | 1,632,322.9 | 1,923,162.0 | 2,265,821.3 |
| Total Cash, percent | .0 | .0 | .0 | .0 | .0 | .0 | .0 | .0 | .0 | .0 |
| Account Receivables | 455,256.0 | 578,148.0 | 687,135.0 | 792,769.0 | 834,147.0 | 1,004,483.7 | 1,183,457.6 | 1,394,320.1 | 1,642,753.0 | 1,935,450.4 |
| Account Receivables, % | 18.26 | 18.6 | 17.26 | 18.04 | 17.55 | 17.94 | 17.94 | 17.94 | 17.94 | 17.94 |
| Inventories | 469,396.0 | 671,461.0 | 993,383.0 | 1,047,741.0 | 1,052,866.0 | 1,247,073.4 | 1,469,270.7 | 1,731,057.9 | 2,039,489.1 | 2,402,874.9 |
| Inventories, % | 18.83 | 21.6 | 24.95 | 23.84 | 22.15 | 22.27 | 22.27 | 22.27 | 22.27 | 22.27 |
| Accounts Payable | 229,746.0 | 302,621.0 | 352,647.0 | 326,033.0 | 362,158.0 | 479,762.1 | 565,243.7 | 665,956.0 | 784,612.7 | 924,411.0 |
| Accounts Payable, % | 9.21 | 9.73 | 8.86 | 7.42 | 7.62 | 8.57 | 8.57 | 8.57 | 8.57 | 8.57 |
| Capital Expenditure | -104,971.0 | -114,106.0 | -175,076.0 | -242,633.0 | -245,985.0 | -257,261.4 | -303,099.0 | -357,103.6 | -420,730.5 | -495,694.2 |
| Capital Expenditure, % | -4.21 | -3.67 | -4.4 | -5.52 | -5.18 | -4.59 | -4.59 | -4.59 | -4.59 | -4.59 |
| Tax Rate, % | 29.6 | 29.6 | 29.6 | 29.6 | 29.6 | 29.6 | 29.6 | 29.6 | 29.6 | 29.6 |
| EBITAT | 156,301.4 | 223,564.9 | 271,762.6 | 290,647.5 | 295,049.6 | 371,106.6 | 437,228.5 | 515,131.7 | 606,915.2 | 715,052.3 |
| Depreciation | ||||||||||
| Changes in Account Receivables | ||||||||||
| Changes in Inventories | ||||||||||
| Changes in Accounts Payable | ||||||||||
| Capital Expenditure | ||||||||||
| UFCF | -509,982.6 | 5,438.9 | -101,972.4 | 76,972.5 | 284,701.6 | 144,372.2 | 145,344.7 | 171,241.5 | 201,752.4 | 237,699.6 |
| WACC, % | 6.23 | 6.23 | 6.25 | 6.24 | 6.26 | 6.24 | 6.24 | 6.24 | 6.24 | 6.24 |
| PV UFCF | ||||||||||
| SUM PV UFCF | 741,372.1 | |||||||||
| Long Term Growth Rate, % | 3.00 | |||||||||
| Free cash flow (T + 1) | 244,831 | |||||||||
| Terminal Value | 7,546,773 | |||||||||
| Present Terminal Value | 5,574,882 | |||||||||
| Enterprise Value | 6,316,254 | |||||||||
| Net Debt | 184,186 | |||||||||
| Equity Value | 6,132,068 | |||||||||
| Diluted Shares Outstanding, MM | 293 | |||||||||
| Equity Value Per Share | 20,929.56 |
What You Will Receive
- Accurate 6367T Financials: Access to both historical and projected data for precise valuation.
- Customizable Parameters: Adjust WACC, tax rates, revenue growth, and capital expenditures as needed.
- Automated Calculations: Dynamic computation of intrinsic value and NPV.
- Scenario Testing: Explore various scenarios to assess Daikin's future performance.
- User-Friendly Design: Designed for professionals but straightforward enough for beginners.
Key Features
- Customizable Forecast Inputs: Adjust vital metrics such as revenue growth, EBITDA percentage, and capital expenditures to suit your analysis.
- Instant DCF Valuation: Automatically determines intrinsic value, NPV, and other financial outputs in real-time.
- High Precision Accuracy: Leverages Daikin Industries' (6367T) actual financial data for trustworthy valuation results.
- Simplified Scenario Analysis: Effortlessly evaluate various assumptions and compare the resulting outcomes.
- Efficiency Booster: Streamline your workflow by avoiding the complexities of building intricate valuation models from the ground up.
How It Works
- Step 1: Download the prebuilt Excel template featuring Daikin Industries, Ltd.'s (6367T) data.
- Step 2: Review the pre-filled sheets to familiarize yourself with the key metrics.
- Step 3: Adjust forecasts and assumptions in the editable yellow cells (WACC, growth, margins).
- Step 4: Immediately see the updated results, including Daikin Industries, Ltd.'s (6367T) intrinsic value.
- Step 5: Utilize the results to make informed investment choices or generate comprehensive reports.
Why Opt for This Calculator?
- Designed for Experts: A sophisticated tool favored by analysts, CFOs, and industry consultants.
- Accurate Data: Daikin Industries, Ltd.’s historical and projected financials preloaded for reliability.
- Flexible Scenario Analysis: Effortlessly simulate various forecasts and assumptions.
- Intuitive Outputs: Automatically computes intrinsic value, NPV, and essential metrics.
- User-Friendly: Detailed step-by-step guidance ensures a smooth experience.
Who Should Use This Product?
- Investors: Accurately assess Daikin Industries, Ltd.'s (6367T) fair value prior to making investment choices.
- CFOs: Utilize a professional-grade DCF model for comprehensive financial reporting and analysis of Daikin Industries, Ltd. (6367T).
- Consultants: Easily customize the template for valuation reports tailored to Daikin Industries, Ltd. (6367T) clients.
- Entrepreneurs: Discover insights into financial modeling practices used by leading corporations like Daikin Industries, Ltd. (6367T).
- Educators: Employ it as a pedagogical tool to illustrate various valuation methodologies relevant to Daikin Industries, Ltd. (6367T).
Contents of the Template
- Operating and Balance Sheet Data: Pre-filled historical data and forecasts for Daikin Industries, Ltd. (6367T), including revenue, EBITDA, EBIT, and capital expenditures.
- WACC Calculation: A specific sheet dedicated to the Weighted Average Cost of Capital (WACC), featuring parameters such as Beta, risk-free rate, and share price.
- DCF Valuation (Unlevered and Levered): Customizable Discounted Cash Flow models that illustrate intrinsic value along with comprehensive calculations.
- Financial Statements: Pre-loaded annual and quarterly financial statements to facilitate in-depth analysis.
- Key Ratios: Includes various profitability, leverage, and efficiency ratios for Daikin Industries, Ltd. (6367T).
- Dashboard and Charts: A visual representation of valuation outputs and assumptions to simplify the analysis of results.
Disclaimer
All information, articles, and product details provided on this website are for general informational and educational purposes only. We do not claim any ownership over, nor do we intend to infringe upon, any trademarks, copyrights, logos, brand names, or other intellectual property mentioned or depicted on this site. Such intellectual property remains the property of its respective owners, and any references here are made solely for identification or informational purposes, without implying any affiliation, endorsement, or partnership.
We make no representations or warranties, express or implied, regarding the accuracy, completeness, or suitability of any content or products presented. Nothing on this website should be construed as legal, tax, investment, financial, medical, or other professional advice. In addition, no part of this site—including articles or product references—constitutes a solicitation, recommendation, endorsement, advertisement, or offer to buy or sell any securities, franchises, or other financial instruments, particularly in jurisdictions where such activity would be unlawful.
All content is of a general nature and may not address the specific circumstances of any individual or entity. It is not a substitute for professional advice or services. Any actions you take based on the information provided here are strictly at your own risk. You accept full responsibility for any decisions or outcomes arising from your use of this website and agree to release us from any liability in connection with your use of, or reliance upon, the content or products found herein.