
|
Fujitec Co., Ltd. (6406.T) Valoración de DCF |
Completamente Editable: Adáptelo A Sus Necesidades En Excel O Sheets
Diseño Profesional: Plantillas Confiables Y Estándares De La Industria
Predeterminadas Para Un Uso Rápido Y Eficiente
Compatible con MAC / PC, completamente desbloqueado
No Se Necesita Experiencia; Fáciles De Seguir
Fujitec Co., Ltd. (6406.T) Bundle
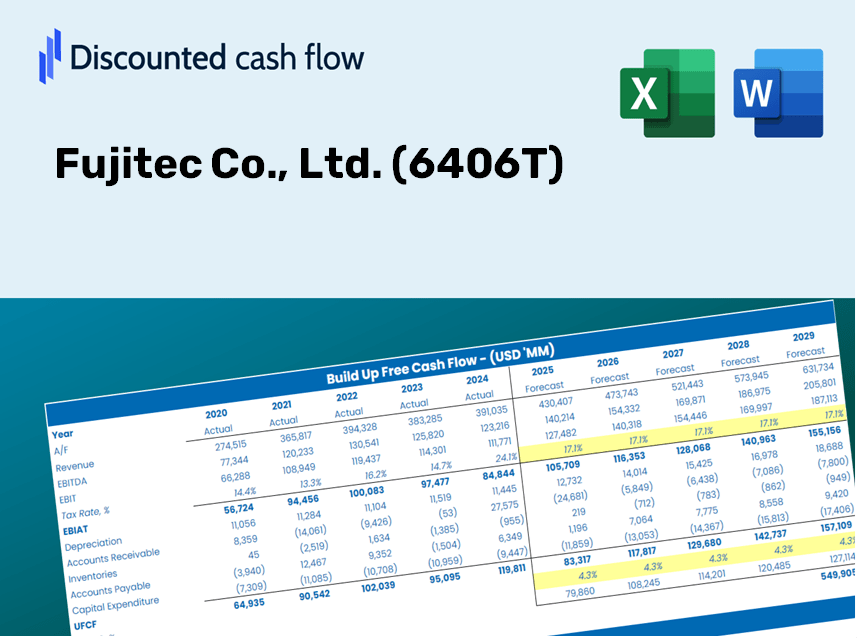
¡Descubra el verdadero valor de Fujitec Co., Ltd. (6406t) con nuestra calculadora DCF avanzada! Ajuste los supuestos clave, explore varios escenarios y evalúe cómo los cambios afectan la valoración de Fujitec Co., Ltd. (6406T), todo convenientemente dentro de una sola plantilla de Excel.
Discounted Cash Flow (DCF) - (USD MM)
| Year | AY1 2021 |
AY2 2022 |
AY3 2023 |
AY4 2024 |
AY5 2025 |
FY1 2026 |
FY2 2027 |
FY3 2028 |
FY4 2029 |
FY5 2030 |
|---|---|---|---|---|---|---|---|---|---|---|
| Revenue | 169,573.0 | 187,018.0 | 207,589.0 | 229,401.0 | 241,253.0 | 263,545.3 | 287,897.5 | 314,499.8 | 343,560.3 | 375,306.0 |
| Revenue Growth, % | 0 | 10.29 | 11 | 10.51 | 5.17 | 9.24 | 9.24 | 9.24 | 9.24 | 9.24 |
| EBITDA | 18,632.0 | 19,705.0 | 16,653.0 | 19,264.0 | 25,085.0 | 25,480.3 | 27,834.8 | 30,406.7 | 33,216.4 | 36,285.7 |
| EBITDA, % | 10.99 | 10.54 | 8.02 | 8.4 | 10.4 | 9.67 | 9.67 | 9.67 | 9.67 | 9.67 |
| Depreciation | 3,457.0 | 3,343.0 | 4,033.0 | 4,705.0 | 4,706.0 | 5,150.0 | 5,625.9 | 6,145.7 | 6,713.6 | 7,333.9 |
| Depreciation, % | 2.04 | 1.79 | 1.94 | 2.05 | 1.95 | 1.95 | 1.95 | 1.95 | 1.95 | 1.95 |
| EBIT | 15,175.0 | 16,362.0 | 12,620.0 | 14,559.0 | 20,379.0 | 20,330.3 | 22,208.9 | 24,261.0 | 26,502.8 | 28,951.7 |
| EBIT, % | 8.95 | 8.75 | 6.08 | 6.35 | 8.45 | 7.71 | 7.71 | 7.71 | 7.71 | 7.71 |
| Total Cash | 68,348.0 | 76,956.0 | 58,297.0 | 80,560.0 | 82,942.0 | 94,367.7 | 103,087.5 | 112,613.0 | 123,018.7 | 134,385.9 |
| Total Cash, percent | .0 | .0 | .0 | .0 | .0 | .0 | .0 | .0 | .0 | .0 |
| Account Receivables | 56,647.0 | 63,004.0 | 72,410.0 | 81,352.0 | 90,343.0 | 92,180.8 | 100,698.5 | 110,003.3 | 120,167.8 | 131,271.6 |
| Account Receivables, % | 33.41 | 33.69 | 34.88 | 35.46 | 37.45 | 34.98 | 34.98 | 34.98 | 34.98 | 34.98 |
| Inventories | 19,245.0 | 15,097.0 | 20,653.0 | 20,916.0 | 21,450.0 | 24,973.2 | 27,280.8 | 29,801.6 | 32,555.3 | 35,563.5 |
| Inventories, % | 11.35 | 8.07 | 9.95 | 9.12 | 8.89 | 9.48 | 9.48 | 9.48 | 9.48 | 9.48 |
| Accounts Payable | 19,760.0 | 19,786.0 | 22,452.0 | 18,181.0 | 19,380.0 | 25,830.9 | 28,217.8 | 30,825.1 | 33,673.5 | 36,785.0 |
| Accounts Payable, % | 11.65 | 10.58 | 10.82 | 7.93 | 8.03 | 9.8 | 9.8 | 9.8 | 9.8 | 9.8 |
| Capital Expenditure | -3,099.0 | -3,469.0 | -3,956.0 | -3,211.0 | -6,459.0 | -5,094.4 | -5,565.1 | -6,079.4 | -6,641.1 | -7,254.8 |
| Capital Expenditure, % | -1.83 | -1.85 | -1.91 | -1.4 | -2.68 | -1.93 | -1.93 | -1.93 | -1.93 | -1.93 |
| Tax Rate, % | 27.34 | 27.34 | 27.34 | 27.34 | 27.34 | 27.34 | 27.34 | 27.34 | 27.34 | 27.34 |
| EBITAT | 9,379.7 | 10,897.6 | 8,557.8 | 10,854.1 | 14,807.5 | 13,964.4 | 15,254.8 | 16,664.3 | 18,204.2 | 19,886.3 |
| Depreciation | ||||||||||
| Changes in Account Receivables | ||||||||||
| Changes in Inventories | ||||||||||
| Changes in Accounts Payable | ||||||||||
| Capital Expenditure | ||||||||||
| UFCF | -46,394.3 | 8,588.6 | -3,661.2 | -1,127.9 | 4,728.5 | 15,110.0 | 6,877.0 | 7,512.5 | 8,206.7 | 8,965.0 |
| WACC, % | 4.67 | 4.67 | 4.67 | 4.68 | 4.68 | 4.67 | 4.67 | 4.67 | 4.67 | 4.67 |
| PV UFCF | ||||||||||
| SUM PV UFCF | 41,235.5 | |||||||||
| Long Term Growth Rate, % | 3.00 | |||||||||
| Free cash flow (T + 1) | 9,234 | |||||||||
| Terminal Value | 552,457 | |||||||||
| Present Terminal Value | 439,701 | |||||||||
| Enterprise Value | 480,936 | |||||||||
| Net Debt | -78,652 | |||||||||
| Equity Value | 559,588 | |||||||||
| Diluted Shares Outstanding, MM | 78 | |||||||||
| Equity Value Per Share | 7,167.41 |
What You Will Receive
- Genuine Fujitec Data: Preloaded financial metrics – encompassing revenue to EBIT – derived from actual and projected figures.
- Comprehensive Customization: Modify all essential parameters (yellow cells) such as WACC, growth %, and tax rates as needed.
- Instant Valuation Refresh: Automatic recalculations to assess the effects of changes on Fujitec’s fair value.
- Flexible Excel Template: Designed for easy edits, scenario analysis, and in-depth forecasts.
- Efficient and Precise: Avoid building models from the ground up while ensuring accuracy and adaptability.
Key Features
- Comprehensive Fujitec Financials: Gain access to precise historical data and future forecasts specific to Fujitec Co., Ltd. (6406T).
- Adjustable Forecast Parameters: Customize pivotal metrics such as WACC, growth rates, and margins in user-friendly highlighted cells.
- Real-Time Calculations: Enjoy automatic updates for DCF, Net Present Value (NPV), and cash flow assessments.
- User-Friendly Dashboard: Benefit from straightforward charts and summaries for clear visualization of your valuation insights.
- Designed for All Skill Levels: An easy-to-navigate layout tailored for investors, CFOs, and consultants alike.
How It Functions
- Step 1: Download the Excel spreadsheet.
- Step 2: Examine the pre-filled data for Fujitec Co., Ltd. (6406T) (historical and forecasted).
- Step 3: Modify key assumptions (highlighted in yellow) based on your insights.
- Step 4: Observe the automatic updates reflecting Fujitec Co., Ltd.'s (6406T) intrinsic value.
- Step 5: Utilize the results for your investment choices or reporting needs.
Why Select This Calculator for Fujitec Co., Ltd. (6406T)?
- User-Friendly Design: Tailored for both novices and seasoned professionals.
- Customizable Inputs: Adjust parameters effortlessly to suit your analysis needs.
- Real-Time Valuation Updates: Observe immediate changes to Fujitec’s valuation as you tweak the inputs.
- Pre-Configured Data: Comes with Fujitec's actual financial metrics for swift evaluations.
- Endorsed by Industry Experts: Utilized by investors and analysts for making well-informed decisions.
Who Should Utilize This Product?
- Investors: Accurately assess Fujitec's fair value before making investment choices.
- CFOs: Utilize a professional-grade DCF model for comprehensive financial reporting and analysis.
- Consultants: Quickly customize the template for valuation reports tailored to clients.
- Entrepreneurs: Acquire insights into financial modeling practices employed by leading companies.
- Educators: Employ it as a teaching resource to illustrate various valuation methodologies.
What the Template Includes
- Pre-Filled DCF Model: Fujitec Co., Ltd.'s (6406T) financial data ready for immediate application.
- WACC Calculator: Comprehensive calculations for Weighted Average Cost of Capital.
- Financial Ratios: Assess Fujitec Co., Ltd.'s (6406T) profitability, leverage, and operational efficiency.
- Editable Inputs: Adjust assumptions such as growth rates, profit margins, and CAPEX to suit your scenarios.
- Financial Statements: Annual and quarterly reports that facilitate in-depth analysis.
- Interactive Dashboard: Intuitively visualize essential valuation metrics and outcomes.
Disclaimer
All information, articles, and product details provided on this website are for general informational and educational purposes only. We do not claim any ownership over, nor do we intend to infringe upon, any trademarks, copyrights, logos, brand names, or other intellectual property mentioned or depicted on this site. Such intellectual property remains the property of its respective owners, and any references here are made solely for identification or informational purposes, without implying any affiliation, endorsement, or partnership.
We make no representations or warranties, express or implied, regarding the accuracy, completeness, or suitability of any content or products presented. Nothing on this website should be construed as legal, tax, investment, financial, medical, or other professional advice. In addition, no part of this site—including articles or product references—constitutes a solicitation, recommendation, endorsement, advertisement, or offer to buy or sell any securities, franchises, or other financial instruments, particularly in jurisdictions where such activity would be unlawful.
All content is of a general nature and may not address the specific circumstances of any individual or entity. It is not a substitute for professional advice or services. Any actions you take based on the information provided here are strictly at your own risk. You accept full responsibility for any decisions or outcomes arising from your use of this website and agree to release us from any liability in connection with your use of, or reliance upon, the content or products found herein.