
|
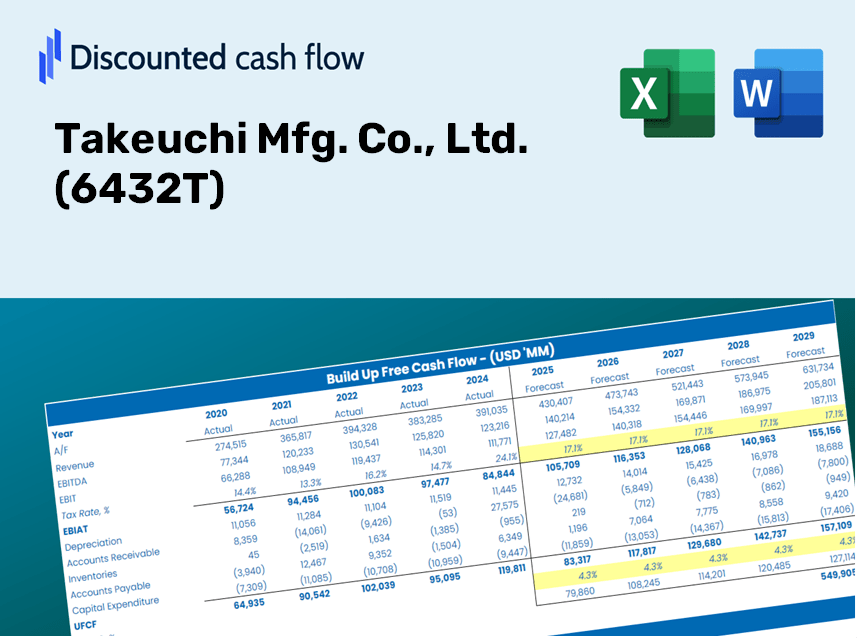
Takeuchi Mfg. Co., Ltd. (6432.t) Valoración de DCF |
Completamente Editable: Adáptelo A Sus Necesidades En Excel O Sheets
Diseño Profesional: Plantillas Confiables Y Estándares De La Industria
Predeterminadas Para Un Uso Rápido Y Eficiente
Compatible con MAC / PC, completamente desbloqueado
No Se Necesita Experiencia; Fáciles De Seguir
Takeuchi Mfg. Co., Ltd. (6432.T) Bundle
¡Optimice su tiempo y mejore la precisión con nuestra calculadora DCF (6432T)! Equipado con datos reales de Takeuchi Mfg. Co., Ltd. y suposiciones personalizables, esta herramienta le permite pronosticar, analizar y valorar Takeuchi Mfg. Co., Ltd. como un inversor experimentado.
Discounted Cash Flow (DCF) - (USD MM)
| Year | AY1 2020 |
AY2 2021 |
AY3 2022 |
AY4 2023 |
AY5 2024 |
FY1 2025 |
FY2 2026 |
FY3 2027 |
FY4 2028 |
FY5 2029 |
|---|---|---|---|---|---|---|---|---|---|---|
| Revenue | 112,254.0 | 140,892.0 | 178,966.0 | 212,627.0 | 213,230.0 | 251,412.8 | 296,433.0 | 349,514.9 | 412,102.2 | 485,896.8 |
| Revenue Growth, % | 0 | 25.51 | 27.02 | 18.81 | 0.2836 | 17.91 | 17.91 | 17.91 | 17.91 | 17.91 |
| EBITDA | 14,884.0 | 19,351.0 | 23,261.0 | 38,618.0 | 39,364.0 | 38,523.7 | 45,422.1 | 53,555.8 | 63,145.9 | 74,453.4 |
| EBITDA, % | 13.26 | 13.73 | 13 | 18.16 | 18.46 | 15.32 | 15.32 | 15.32 | 15.32 | 15.32 |
| Depreciation | 1,676.0 | 1,586.0 | 2,039.0 | 3,321.0 | 3,755.0 | 3,560.5 | 4,198.1 | 4,949.8 | 5,836.1 | 6,881.2 |
| Depreciation, % | 1.49 | 1.13 | 1.14 | 1.56 | 1.76 | 1.42 | 1.42 | 1.42 | 1.42 | 1.42 |
| EBIT | 13,208.0 | 17,765.0 | 21,222.0 | 35,297.0 | 35,609.0 | 34,963.2 | 41,224.0 | 48,606.0 | 57,309.8 | 67,572.2 |
| EBIT, % | 11.77 | 12.61 | 11.86 | 16.6 | 16.7 | 13.91 | 13.91 | 13.91 | 13.91 | 13.91 |
| Total Cash | 40,227.0 | 47,258.0 | 43,995.0 | 55,175.0 | 46,482.0 | 71,254.8 | 84,014.3 | 99,058.7 | 116,797.0 | 137,711.7 |
| Total Cash, percent | .0 | .0 | .0 | .0 | .0 | .0 | .0 | .0 | .0 | .0 |
| Account Receivables | 26,094.0 | 24,658.0 | 34,602.0 | 44,572.0 | 44,388.0 | 51,218.2 | 60,389.8 | 71,203.7 | 83,954.1 | 98,987.6 |
| Account Receivables, % | 23.25 | 17.5 | 19.33 | 20.96 | 20.82 | 20.37 | 20.37 | 20.37 | 20.37 | 20.37 |
| Inventories | 29,325.0 | 41,351.0 | 47,722.0 | 58,262.0 | 80,496.0 | 74,061.4 | 87,323.5 | 102,960.4 | 121,397.4 | 143,135.9 |
| Inventories, % | 26.12 | 29.35 | 26.67 | 27.4 | 37.75 | 29.46 | 29.46 | 29.46 | 29.46 | 29.46 |
| Accounts Payable | 19,471.0 | 24,491.0 | 26,755.0 | 36,381.0 | 36,022.0 | 42,077.4 | 49,612.1 | 58,496.1 | 68,970.9 | 81,321.4 |
| Accounts Payable, % | 17.35 | 17.38 | 14.95 | 17.11 | 16.89 | 16.74 | 16.74 | 16.74 | 16.74 | 16.74 |
| Capital Expenditure | -2,045.0 | -4,602.0 | -9,001.0 | -7,862.0 | -3,269.0 | -7,717.5 | -9,099.4 | -10,728.8 | -12,650.0 | -14,915.3 |
| Capital Expenditure, % | -1.82 | -3.27 | -5.03 | -3.7 | -1.53 | -3.07 | -3.07 | -3.07 | -3.07 | -3.07 |
| Tax Rate, % | 26.67 | 26.67 | 26.67 | 26.67 | 26.67 | 26.67 | 26.67 | 26.67 | 26.67 | 26.67 |
| EBITAT | 9,698.9 | 13,115.4 | 15,861.7 | 26,032.5 | 26,113.7 | 25,809.0 | 30,430.6 | 35,879.8 | 42,304.8 | 49,880.2 |
| Depreciation | ||||||||||
| Changes in Account Receivables | ||||||||||
| Changes in Inventories | ||||||||||
| Changes in Accounts Payable | ||||||||||
| Capital Expenditure | ||||||||||
| UFCF | -26,618.1 | 4,529.4 | -5,151.3 | 10,607.5 | 4,190.7 | 27,311.8 | 10,630.3 | 12,533.9 | 14,778.3 | 17,424.7 |
| WACC, % | 5.29 | 5.29 | 5.29 | 5.29 | 5.29 | 5.29 | 5.29 | 5.29 | 5.29 | 5.29 |
| PV UFCF | ||||||||||
| SUM PV UFCF | 71,755.9 | |||||||||
| Long Term Growth Rate, % | 2.00 | |||||||||
| Free cash flow (T + 1) | 17,773 | |||||||||
| Terminal Value | 540,112 | |||||||||
| Present Terminal Value | 417,383 | |||||||||
| Enterprise Value | 489,139 | |||||||||
| Net Debt | -46,482 | |||||||||
| Equity Value | 535,621 | |||||||||
| Diluted Shares Outstanding, MM | 47 | |||||||||
| Equity Value Per Share | 11,331.58 |
What You Will Receive
- Authentic Takeuchi Mfg. Co., Ltd. Financial Data: Pre-loaded with historical and projected metrics for accurate analysis.
- Fully Customizable Template: Easily adjust key parameters like revenue growth, WACC, and EBITDA percentages.
- Instant Calculations: Observe real-time updates of Takeuchi's intrinsic value as you make adjustments.
- Professional Valuation Tool: Crafted for investors, analysts, and consultants aiming for precise DCF outputs.
- User-Friendly Interface: Intuitive layout and straightforward instructions suitable for all skill levels.
Key Features
- Pre-Loaded Data: Takeuchi Mfg. Co., Ltd.'s historical financial statements and pre-filled forecasts.
- Fully Adjustable Inputs: Customize WACC, tax rates, revenue growth, and EBITDA margins as needed.
- Instant Results: Watch the intrinsic value of Takeuchi Mfg. Co., Ltd. (6432T) update in real time.
- Clear Visual Outputs: Dashboard graphs illustrate valuation results and essential metrics.
- Built for Accuracy: A professional-grade tool designed for analysts, investors, and finance professionals.
How It Operates
- Download: Obtain the pre-configured Excel file containing Takeuchi Mfg. Co., Ltd.'s (6432T) financial data.
- Customize: Modify your forecasts, such as revenue growth, EBITDA %, and WACC.
- Update Automatically: The intrinsic value and NPV calculations refresh in real-time.
- Test Scenarios: Generate various projections and analyze outcomes instantly.
- Make Decisions: Leverage the valuation results to inform your investment strategy.
Why Choose This Calculator for Takeuchi Mfg. Co., Ltd. (6432T)?
- Reliable Data: Access accurate financial metrics specific to Takeuchi Mfg. Co., Ltd. for trustworthy valuation outcomes.
- Tailorable: Modify essential variables such as growth rates, WACC, and tax rates to align with your forecasts.
- Efficient: Built-in calculations save you time, allowing you to focus on analysis instead of setup.
- Expert-Level Tool: Crafted for investors, analysts, and consultants seeking in-depth insights.
- User-Friendly: Designed with an intuitive interface and straightforward directions for all experience levels.
Who Should Utilize This Product?
- Institutional Investors: Develop comprehensive and accurate valuation models for investment analysis in Takeuchi Mfg. Co., Ltd. (6432T).
- Financial Analysts: Explore valuation scenarios to inform strategic decisions within corporate settings.
- Consultants and Advisors: Equip clients with precise valuation assessments for Takeuchi Mfg. Co., Ltd. (6432T).
- Students and Educators: Leverage real-world data to enhance learning and practice in financial modeling.
- Manufacturing Sector Enthusiasts: Gain insights into how companies like Takeuchi Mfg. Co., Ltd. (6432T) are valued in the industry.
Contents of the Template
- Historical Data: Contains past financial records and baseline forecasts for Takeuchi Mfg. Co., Ltd. (6432T).
- DCF and Levered DCF Models: Comprehensive templates for determining the intrinsic value of Takeuchi Mfg. Co., Ltd. (6432T).
- WACC Sheet: Pre-formulated calculations for the Weighted Average Cost of Capital.
- Editable Inputs: Customize essential variables such as growth rates, EBITDA percentages, and CAPEX assumptions.
- Quarterly and Annual Statements: Thorough analysis of Takeuchi Mfg. Co., Ltd. (6432T)'s financials.
- Interactive Dashboard: Dynamically visualize valuation results and future projections.
Disclaimer
All information, articles, and product details provided on this website are for general informational and educational purposes only. We do not claim any ownership over, nor do we intend to infringe upon, any trademarks, copyrights, logos, brand names, or other intellectual property mentioned or depicted on this site. Such intellectual property remains the property of its respective owners, and any references here are made solely for identification or informational purposes, without implying any affiliation, endorsement, or partnership.
We make no representations or warranties, express or implied, regarding the accuracy, completeness, or suitability of any content or products presented. Nothing on this website should be construed as legal, tax, investment, financial, medical, or other professional advice. In addition, no part of this site—including articles or product references—constitutes a solicitation, recommendation, endorsement, advertisement, or offer to buy or sell any securities, franchises, or other financial instruments, particularly in jurisdictions where such activity would be unlawful.
All content is of a general nature and may not address the specific circumstances of any individual or entity. It is not a substitute for professional advice or services. Any actions you take based on the information provided here are strictly at your own risk. You accept full responsibility for any decisions or outcomes arising from your use of this website and agree to release us from any liability in connection with your use of, or reliance upon, the content or products found herein.