
|
Amano Corporation (6436.T) Valoración de DCF |
Completamente Editable: Adáptelo A Sus Necesidades En Excel O Sheets
Diseño Profesional: Plantillas Confiables Y Estándares De La Industria
Predeterminadas Para Un Uso Rápido Y Eficiente
Compatible con MAC / PC, completamente desbloqueado
No Se Necesita Experiencia; Fáciles De Seguir
Amano Corporation (6436.T) Bundle
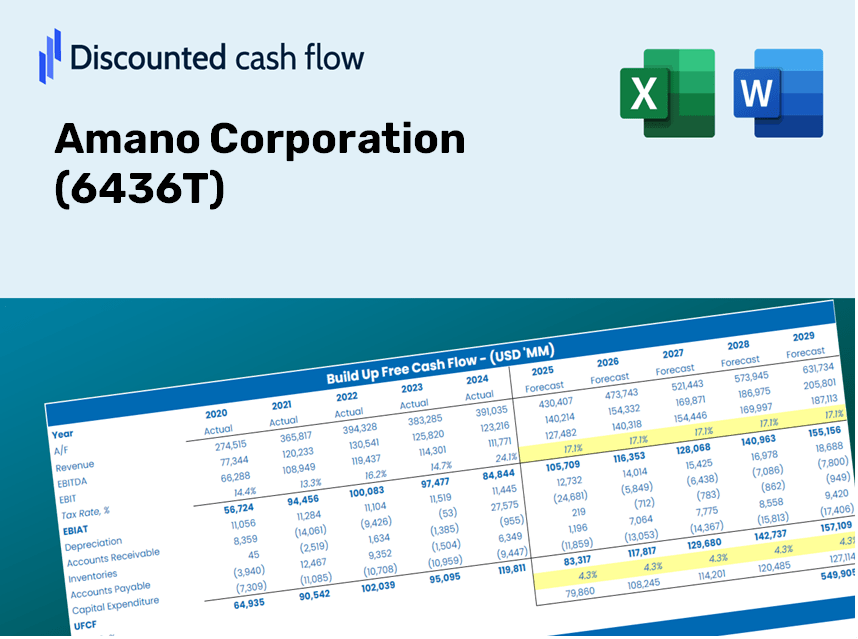
¡Mejore sus opciones de inversión con la calculadora DCF de Amano Corporation (6436T)! Explore los auténticos datos financieros de Amano, ajuste las proyecciones y gastos de crecimiento, y observe instantáneamente cómo estas modificaciones afectan el valor intrínseco de Amano Corporation.
What You'll Receive
- Accurate AMANO Financial Data: Pre-loaded with Amano Corporation’s historical and projected metrics for detailed analysis.
- Completely Customizable Template: Effortlessly adjust key factors such as revenue growth, WACC, and EBITDA percentage.
- Real-Time Calculations: Watch as Amano Corporation's intrinsic value updates instantly with your modifications.
- Professional Valuation Tool: Crafted for investors, analysts, and consultants aiming for reliable DCF outcomes.
- Intuitive Design: User-friendly layout and straightforward instructions suitable for all skill levels.
Key Features
- Customizable Forecast Settings: Adjust essential variables such as sales growth, EBITDA margin, and capital investments.
- Instant DCF Valuation: Automatically computes intrinsic value, NPV, and additional financial metrics.
- High-Precision Accuracy: Leverages Amano Corporation's (6436T) real-world financial data for credible valuation results.
- Simplified Scenario Analysis: Easily evaluate various assumptions and assess the results side by side.
- Efficiency Booster: Say goodbye to the complexity of creating valuation models from the ground up.
How It Works
- Download the Template: Gain immediate access to the Excel-based Amano Corporation (6436T) DCF Calculator.
- Input Your Assumptions: Modify the yellow-highlighted cells for growth rates, WACC, profit margins, and more.
- Instant Calculations: The model automatically recalculates Amano Corporation’s intrinsic value.
- Test Scenarios: Experiment with different assumptions to see how they affect potential valuations.
- Analyze and Decide: Utilize the results to inform your investment or financial strategy.
Why Choose This Calculator for Amano Corporation (6436T)?
- User-Friendly Design: Perfect for both novices and seasoned users.
- Customizable Inputs: Adjust parameters effortlessly to suit your analysis needs.
- Real-Time Updates: Monitor immediate changes to Amano Corporation’s valuation as you tweak inputs.
- Preloaded Data: Comes equipped with Amano Corporation’s latest financial information for expedited analysis.
- Relied Upon by Experts: Trusted by investors and financial analysts for informed decision-making.
Who Should Utilize Amano Corporation (6436T)?
- Individual Investors: Gain insights for making informed decisions about trading Amano Corporation (6436T) shares.
- Financial Analysts: Enhance valuation analyses with accessible financial models tailored for Amano Corporation (6436T).
- Consultants: Provide clients with timely and precise valuation insights related to Amano Corporation (6436T).
- Business Owners: Learn how large corporations like Amano Corporation (6436T) are valued to inform your own business strategies.
- Finance Students: Explore valuation methodologies using real-world data from Amano Corporation (6436T) and similar cases.
Contents of the Template
- Historical Data: Features Amano Corporation's past financial performance and baseline forecasts.
- DCF and Levered DCF Models: Comprehensive templates for calculating the intrinsic value of Amano Corporation (6436T).
- WACC Sheet: Pre-configured calculations for the Weighted Average Cost of Capital.
- Editable Inputs: Customize key factors such as growth rates, EBITDA percentages, and CAPEX assumptions.
- Quarterly and Annual Statements: An in-depth analysis of Amano Corporation's financial statements.
- Interactive Dashboard: Dynamically visualize valuation outcomes and projections.
Disclaimer
All information, articles, and product details provided on this website are for general informational and educational purposes only. We do not claim any ownership over, nor do we intend to infringe upon, any trademarks, copyrights, logos, brand names, or other intellectual property mentioned or depicted on this site. Such intellectual property remains the property of its respective owners, and any references here are made solely for identification or informational purposes, without implying any affiliation, endorsement, or partnership.
We make no representations or warranties, express or implied, regarding the accuracy, completeness, or suitability of any content or products presented. Nothing on this website should be construed as legal, tax, investment, financial, medical, or other professional advice. In addition, no part of this site—including articles or product references—constitutes a solicitation, recommendation, endorsement, advertisement, or offer to buy or sell any securities, franchises, or other financial instruments, particularly in jurisdictions where such activity would be unlawful.
All content is of a general nature and may not address the specific circumstances of any individual or entity. It is not a substitute for professional advice or services. Any actions you take based on the information provided here are strictly at your own risk. You accept full responsibility for any decisions or outcomes arising from your use of this website and agree to release us from any liability in connection with your use of, or reliance upon, the content or products found herein.