
|
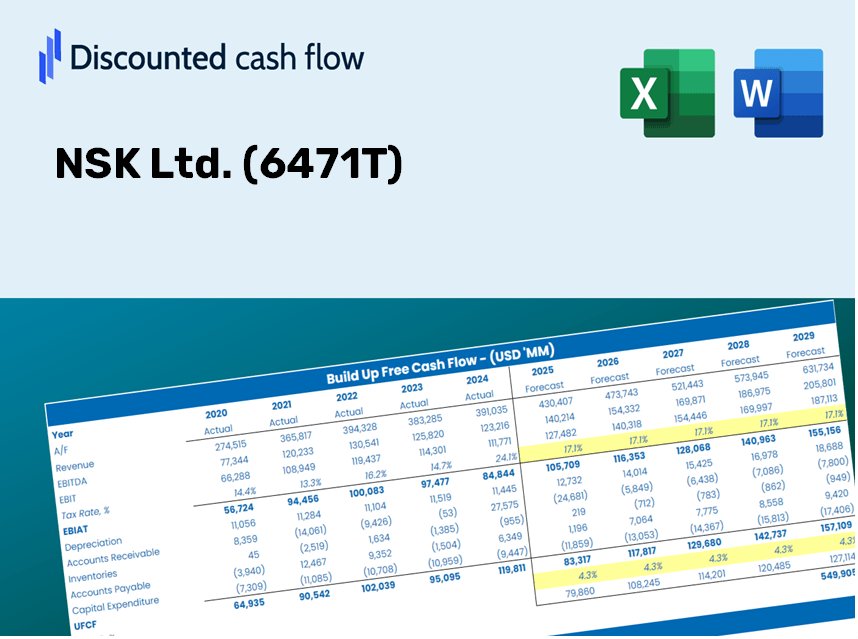
NSK Ltd. (6471.T) Valoración de DCF |
Completamente Editable: Adáptelo A Sus Necesidades En Excel O Sheets
Diseño Profesional: Plantillas Confiables Y Estándares De La Industria
Predeterminadas Para Un Uso Rápido Y Eficiente
Compatible con MAC / PC, completamente desbloqueado
No Se Necesita Experiencia; Fáciles De Seguir
NSK Ltd. (6471.T) Bundle
¡Aproveche la oportunidad de mejorar su análisis de valoración de NSK Ltd. (6471T) utilizando nuestra sofisticada calculadora DCF! Con datos reales (6471T) precargados, esta plantilla de Excel le permite ajustar los pronósticos y supuestos para determinar con precisión el valor intrínseco de NSK Ltd.
Discounted Cash Flow (DCF) - (USD MM)
| Year | AY1 2021 |
AY2 2022 |
AY3 2023 |
AY4 2024 |
AY5 2025 |
FY1 2026 |
FY2 2027 |
FY3 2028 |
FY4 2029 |
FY5 2030 |
|---|---|---|---|---|---|---|---|---|---|---|
| Revenue | 747,559.0 | 865,166.0 | 776,762.0 | 788,867.0 | 796,667.0 | 812,722.1 | 829,100.8 | 845,809.5 | 862,854.9 | 880,243.9 |
| Revenue Growth, % | 0 | 15.73 | -10.22 | 1.56 | 0.98876 | 2.02 | 2.02 | 2.02 | 2.02 | 2.02 |
| EBITDA | 58,953.0 | 84,432.0 | 101,318.0 | 80,768.0 | 84,115.0 | 83,687.0 | 85,373.5 | 87,094.0 | 88,849.2 | 90,639.8 |
| EBITDA, % | 7.89 | 9.76 | 13.04 | 10.24 | 10.56 | 10.3 | 10.3 | 10.3 | 10.3 | 10.3 |
| Depreciation | 54,527.0 | 56,558.0 | 58,376.0 | 54,121.0 | 52,412.0 | 56,542.8 | 57,682.3 | 58,844.8 | 60,030.6 | 61,240.4 |
| Depreciation, % | 7.29 | 6.54 | 7.52 | 6.86 | 6.58 | 6.96 | 6.96 | 6.96 | 6.96 | 6.96 |
| EBIT | 4,426.0 | 27,874.0 | 42,942.0 | 26,647.0 | 31,703.0 | 27,144.2 | 27,691.2 | 28,249.3 | 28,818.6 | 29,399.3 |
| EBIT, % | 0.59206 | 3.22 | 5.53 | 3.38 | 3.98 | 3.34 | 3.34 | 3.34 | 3.34 | 3.34 |
| Total Cash | 178,207.0 | 139,162.0 | 161,699.0 | 195,659.0 | 201,045.0 | 180,064.9 | 183,693.7 | 187,395.7 | 191,172.2 | 195,024.9 |
| Total Cash, percent | .0 | .0 | .0 | .0 | .0 | .0 | .0 | .0 | .0 | .0 |
| Account Receivables | 185,228.0 | 209,351.0 | 207,812.0 | 220,248.0 | 217,360.0 | 212,823.2 | 217,112.2 | 221,487.6 | 225,951.2 | 230,504.8 |
| Account Receivables, % | 24.78 | 24.2 | 26.75 | 27.92 | 27.28 | 26.19 | 26.19 | 26.19 | 26.19 | 26.19 |
| Inventories | 150,046.0 | 196,736.0 | 197,754.0 | 185,886.0 | 185,878.0 | 187,195.1 | 190,967.7 | 194,816.2 | 198,742.3 | 202,747.5 |
| Inventories, % | 20.07 | 22.74 | 25.46 | 23.56 | 23.33 | 23.03 | 23.03 | 23.03 | 23.03 | 23.03 |
| Accounts Payable | 108,406.0 | 119,855.0 | 112,535.0 | 140,451.0 | 126,551.0 | 124,397.9 | 126,904.9 | 129,462.4 | 132,071.4 | 134,733.0 |
| Accounts Payable, % | 14.5 | 13.85 | 14.49 | 17.8 | 15.89 | 15.31 | 15.31 | 15.31 | 15.31 | 15.31 |
| Capital Expenditure | -33,797.0 | -36,063.0 | -51,749.0 | -58,697.0 | -50,355.0 | -47,321.3 | -48,275.0 | -49,247.8 | -50,240.3 | -51,252.8 |
| Capital Expenditure, % | -4.52 | -4.17 | -6.66 | -7.44 | -6.32 | -5.82 | -5.82 | -5.82 | -5.82 | -5.82 |
| Tax Rate, % | 57.58 | 57.58 | 57.58 | 57.58 | 57.58 | 57.58 | 57.58 | 57.58 | 57.58 | 57.58 |
| EBITAT | 266.8 | 15,664.3 | 18,267.4 | 5,235.0 | 13,447.9 | 9,056.8 | 9,239.4 | 9,425.6 | 9,615.5 | 9,809.3 |
| Depreciation | ||||||||||
| Changes in Account Receivables | ||||||||||
| Changes in Inventories | ||||||||||
| Changes in Accounts Payable | ||||||||||
| Capital Expenditure | ||||||||||
| UFCF | -205,871.2 | -23,204.7 | 18,095.4 | 28,007.0 | 4,500.9 | 19,344.9 | 13,092.2 | 13,356.0 | 13,625.2 | 13,899.8 |
| WACC, % | 2.49 | 3.34 | 3.11 | 2.72 | 3.11 | 2.95 | 2.95 | 2.95 | 2.95 | 2.95 |
| PV UFCF | ||||||||||
| SUM PV UFCF | 67,523.7 | |||||||||
| Long Term Growth Rate, % | 3.50 | |||||||||
| Free cash flow (T + 1) | 14,386 | |||||||||
| Terminal Value | -2,637,921 | |||||||||
| Present Terminal Value | -2,280,511 | |||||||||
| Enterprise Value | -2,212,987 | |||||||||
| Net Debt | -138,253 | |||||||||
| Equity Value | -2,074,734 | |||||||||
| Diluted Shares Outstanding, MM | 490 | |||||||||
| Equity Value Per Share | -4,230.53 |
What You'll Receive
- Customizable Excel Template: A fully adjustable Excel-based DCF Calculator featuring pre-populated financial data for NSK Ltd. (6471T).
- Actual Market Data: Access to historical data alongside forward-looking projections (highlighted in the yellow cells).
- Adjustable Forecast Assumptions: Modify key variables such as revenue growth, EBITDA margin, and WACC.
- Instant Calculations: Quickly visualize how your changes affect NSK Ltd.’s (6471T) valuation.
- Professional Resource: Designed for investors, CFOs, consultants, and financial analysts.
- Intuitive Layout: Organized for user clarity and convenience, complete with step-by-step guidance.
Key Features
- 🔍 Real-Life NSK Financials: Pre-filled historical and projected data for NSK Ltd. (6471T).
- ✏️ Fully Customizable Inputs: Adjust all critical parameters (yellow cells) such as WACC, growth %, and tax rates.
- 📊 Professional DCF Valuation: Integrated formulas calculate NSK's intrinsic value using the Discounted Cash Flow method.
- ⚡ Instant Results: View NSK's valuation instantly after making any adjustments.
- Scenario Analysis: Evaluate and compare outcomes for different financial assumptions side-by-side.
How It Functions
- 1. Access the Template: Download and open the Excel spreadsheet containing NSK Ltd.'s (6471T) preloaded data.
- 2. Adjust Assumptions: Modify critical inputs such as growth rates, WACC, and capital expenditures.
- 3. View Results Immediately: The DCF model automatically computes intrinsic value and NPV.
- 4. Explore Different Scenarios: Evaluate various forecasts to investigate different valuation results.
- 5. Present with Assurance: Share professional valuation insights to inform your decision-making.
Why Choose NSK Ltd. (6471T) Calculator?
- Precision: Utilizes real financial data from NSK Ltd. for reliable results.
- Versatility: Crafted to allow users to experiment and adjust inputs seamlessly.
- Efficiency: Eliminate the need to construct a financial model from the ground up.
- High-Quality: Created with the accuracy and functionality expected at the CFO level.
- Intuitive: Straightforward interface suitable for users without advanced financial skills.
Who Can Benefit from NSK Ltd. (6471T)?
- Investors: Empower your investment choices with a high-quality analysis tool.
- Financial Analysts: Streamline your workflow with a customizable pre-built financial model.
- Consultants: Effortlessly modify the template for impactful client presentations or reports.
- Finance Enthusiasts: Enhance your knowledge of valuation methodologies using real-life case studies.
- Educators and Students: Utilize it as a hands-on resource for finance education.
Contents of the NSK Ltd. (6471T) Template
- Preloaded NSK Data: Historical and projected financial information, encompassing revenue, EBIT, and capital expenditures.
- DCF and WACC Models: Professional templates designed for calculating intrinsic value and Weighted Average Cost of Capital.
- Editable Inputs: Cells highlighted in yellow for customizing revenue growth, tax rates, and discount rates.
- Financial Statements: Detailed annual and quarterly financial reports for in-depth analysis.
- Key Ratios: Profitability, leverage, and efficiency metrics to assess performance.
- Dashboard and Charts: Visual representations of valuation results and underlying assumptions.
Disclaimer
All information, articles, and product details provided on this website are for general informational and educational purposes only. We do not claim any ownership over, nor do we intend to infringe upon, any trademarks, copyrights, logos, brand names, or other intellectual property mentioned or depicted on this site. Such intellectual property remains the property of its respective owners, and any references here are made solely for identification or informational purposes, without implying any affiliation, endorsement, or partnership.
We make no representations or warranties, express or implied, regarding the accuracy, completeness, or suitability of any content or products presented. Nothing on this website should be construed as legal, tax, investment, financial, medical, or other professional advice. In addition, no part of this site—including articles or product references—constitutes a solicitation, recommendation, endorsement, advertisement, or offer to buy or sell any securities, franchises, or other financial instruments, particularly in jurisdictions where such activity would be unlawful.
All content is of a general nature and may not address the specific circumstances of any individual or entity. It is not a substitute for professional advice or services. Any actions you take based on the information provided here are strictly at your own risk. You accept full responsibility for any decisions or outcomes arising from your use of this website and agree to release us from any liability in connection with your use of, or reliance upon, the content or products found herein.