
|
Sinfonia Technology Co., Ltd. (6507.T) Valoración de DCF |
Completamente Editable: Adáptelo A Sus Necesidades En Excel O Sheets
Diseño Profesional: Plantillas Confiables Y Estándares De La Industria
Predeterminadas Para Un Uso Rápido Y Eficiente
Compatible con MAC / PC, completamente desbloqueado
No Se Necesita Experiencia; Fáciles De Seguir
Sinfonia Technology Co.,Ltd. (6507.T) Bundle
Descubra el verdadero valor de Sinfonia Technology Co., Ltd. (6507t) ¡Con nuestra calculadora DCF avanzada! Ajuste los supuestos críticos, explore varios escenarios y examine cómo las diferentes variables afectan la valoración de Sinfonia Technology Co., Ltd. (6507t): todo dentro de una conveniente plantilla de Excel.
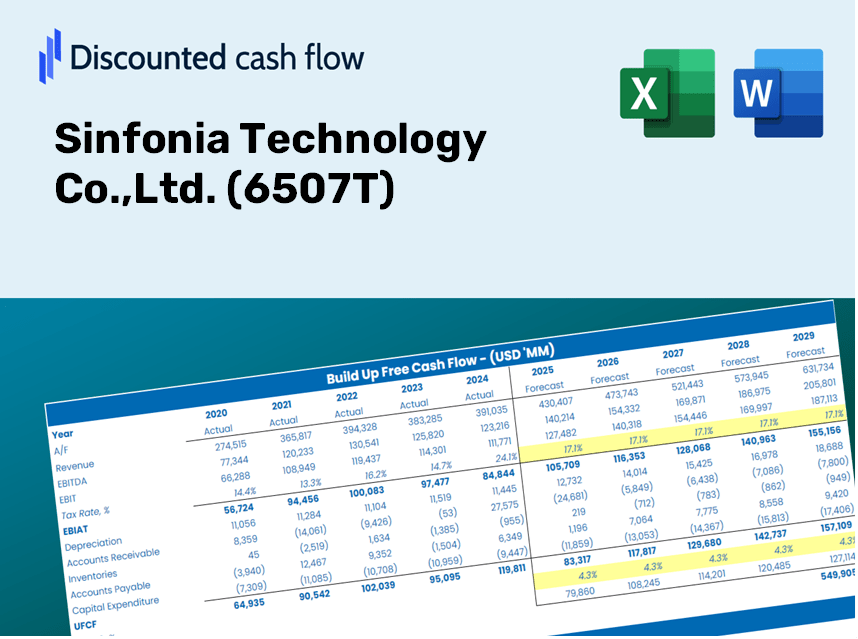
Discounted Cash Flow (DCF) - (USD MM)
| Year | AY1 2020 |
AY2 2021 |
AY3 2022 |
AY4 2023 |
AY5 2024 |
FY1 2025 |
FY2 2026 |
FY3 2027 |
FY4 2028 |
FY5 2029 |
|---|---|---|---|---|---|---|---|---|---|---|
| Revenue | 87,312.0 | 94,585.0 | 108,808.0 | 102,657.0 | 119,150.0 | 129,212.3 | 140,124.3 | 151,957.9 | 164,790.8 | 178,707.5 |
| Revenue Growth, % | 0 | 8.33 | 15.04 | -5.65 | 16.07 | 8.45 | 8.45 | 8.45 | 8.45 | 8.45 |
| EBITDA | 8,061.0 | 11,247.0 | 14,184.0 | 13,929.0 | 19,933.0 | 16,657.3 | 18,064.0 | 19,589.5 | 21,243.8 | 23,037.9 |
| EBITDA, % | 9.23 | 11.89 | 13.04 | 13.57 | 16.73 | 12.89 | 12.89 | 12.89 | 12.89 | 12.89 |
| Depreciation | 3,170.0 | 3,203.0 | 3,233.0 | 3,486.0 | 2,978.0 | 4,104.7 | 4,451.3 | 4,827.2 | 5,234.9 | 5,677.0 |
| Depreciation, % | 3.63 | 3.39 | 2.97 | 3.4 | 2.5 | 3.18 | 3.18 | 3.18 | 3.18 | 3.18 |
| EBIT | 4,891.0 | 8,044.0 | 10,951.0 | 10,443.0 | 16,955.0 | 12,552.6 | 13,612.6 | 14,762.2 | 16,008.9 | 17,360.9 |
| EBIT, % | 5.6 | 8.5 | 10.06 | 10.17 | 14.23 | 9.71 | 9.71 | 9.71 | 9.71 | 9.71 |
| Total Cash | 12,359.0 | 8,734.0 | 9,494.0 | 9,573.0 | 10,221.0 | 12,925.9 | 14,017.5 | 15,201.2 | 16,485.0 | 17,877.2 |
| Total Cash, percent | .0 | .0 | .0 | .0 | .0 | .0 | .0 | .0 | .0 | .0 |
| Account Receivables | 29,526.0 | 34,801.0 | 37,251.0 | 37,993.0 | 41,050.0 | 45,562.2 | 49,410.0 | 53,582.7 | 58,107.7 | 63,015.0 |
| Account Receivables, % | 33.82 | 36.79 | 34.24 | 37.01 | 34.45 | 35.26 | 35.26 | 35.26 | 35.26 | 35.26 |
| Inventories | 16,187.0 | 23,576.0 | 26,774.0 | 24,444.0 | 25,060.0 | 29,180.1 | 31,644.4 | 34,316.7 | 37,214.8 | 40,357.6 |
| Inventories, % | 18.54 | 24.93 | 24.61 | 23.81 | 21.03 | 22.58 | 22.58 | 22.58 | 22.58 | 22.58 |
| Accounts Payable | 16,943.0 | 22,893.0 | 20,819.0 | 18,153.0 | 16,302.0 | 24,319.7 | 26,373.5 | 28,600.8 | 31,016.1 | 33,635.4 |
| Accounts Payable, % | 19.41 | 24.2 | 19.13 | 17.68 | 13.68 | 18.82 | 18.82 | 18.82 | 18.82 | 18.82 |
| Capital Expenditure | -3,156.0 | -1,606.0 | -4,080.0 | -7,237.0 | -2,975.0 | -4,809.0 | -5,215.1 | -5,655.5 | -6,133.1 | -6,651.1 |
| Capital Expenditure, % | -3.61 | -1.7 | -3.75 | -7.05 | -2.5 | -3.72 | -3.72 | -3.72 | -3.72 | -3.72 |
| Tax Rate, % | 27.95 | 27.95 | 27.95 | 27.95 | 27.95 | 27.95 | 27.95 | 27.95 | 27.95 | 27.95 |
| EBITAT | 3,540.9 | 5,696.4 | 8,205.9 | 7,618.3 | 12,216.6 | 9,116.9 | 9,886.8 | 10,721.8 | 11,627.3 | 12,609.2 |
| Depreciation | ||||||||||
| Changes in Account Receivables | ||||||||||
| Changes in Inventories | ||||||||||
| Changes in Accounts Payable | ||||||||||
| Capital Expenditure | ||||||||||
| UFCF | -25,215.1 | 579.4 | -363.1 | 2,789.3 | 6,695.6 | 7,798.0 | 4,864.8 | 5,275.7 | 5,721.2 | 6,204.4 |
| WACC, % | 7.72 | 7.71 | 7.72 | 7.72 | 7.71 | 7.72 | 7.72 | 7.72 | 7.72 | 7.72 |
| PV UFCF | ||||||||||
| SUM PV UFCF | 24,181.9 | |||||||||
| Long Term Growth Rate, % | 0.50 | |||||||||
| Free cash flow (T + 1) | 6,235 | |||||||||
| Terminal Value | 86,411 | |||||||||
| Present Terminal Value | 59,589 | |||||||||
| Enterprise Value | 83,771 | |||||||||
| Net Debt | 4,714 | |||||||||
| Equity Value | 79,057 | |||||||||
| Diluted Shares Outstanding, MM | 28 | |||||||||
| Equity Value Per Share | 2,802.76 |
What You Will Receive
- Authentic Sinfonia Data: Preloaded financial metrics – from revenue to EBIT – utilizing real and forecasted figures.
- Comprehensive Customization: Modify essential parameters (highlighted cells) such as WACC, growth rates, and tax percentages.
- Immediate Valuation Adjustments: Automatic updates to assess the effects of alterations on Sinfonia Technology’s fair value.
- Flexible Excel Template: Designed for quick modifications, scenario analysis, and in-depth forecasts.
- Efficient and Precise: Eliminate the hassle of building models from scratch while enjoying accuracy and adaptability.
Core Features
- Authentic 6507T Data: Pre-populated with Sinfonia Technology’s historical financial performance and future projections.
- Customizable Parameters: Modify growth rates, profit margins, discount rates, tax implications, and capital expenditures at your discretion.
- Adaptive Valuation Framework: Automatic recalculations of Net Present Value (NPV) and intrinsic value based on your modifications.
- Scenario Analysis: Construct various forecasting scenarios to evaluate different valuation results.
- User-Friendly Interface: Intuitive, organized, and crafted for both industry professionals and newcomers.
How It Works
- Step 1: Download the Excel file.
- Step 2: Examine Sinfonia Technology Co.,Ltd.'s pre-filled financial data and forecasts.
- Step 3: Adjust essential inputs such as revenue growth, WACC, and tax rates (highlighted cells).
- Step 4: Observe the DCF model refresh in real-time as you modify assumptions.
- Step 5: Evaluate the outputs and leverage the results for investment choices.
Why Opt for Sinfonia Technology Co., Ltd. (6507T) Calculator?
- User-Friendly Design: Tailored for both novices and seasoned professionals.
- Customizable Inputs: Easily adjust parameters to suit your analysis needs.
- Real-Time Feedback: Observe immediate updates to Sinfonia’s valuation as you tweak inputs.
- Preloaded Data: Comes equipped with Sinfonia’s current financial figures for swift evaluations.
- Relied Upon by Experts: Favored by investors and analysts for making well-informed choices.
Who Can Benefit from Sinfonia Technology Co., Ltd. (6507T)?
- Investors: Assess the intrinsic value of Sinfonia Technology Co., Ltd. (6507T) to inform your investment choices.
- CFOs: Utilize a high-quality DCF model for accurate financial reporting and strategic analysis.
- Consultants: Efficiently customize valuation templates for client reports related to Sinfonia Technology Co., Ltd. (6507T).
- Entrepreneurs: Discover financial modeling techniques employed by leading technology firms.
- Educators: Implement this resource as a practical tool for teaching valuation principles and methods.
Contents of the Template
- Comprehensive DCF Model: An editable template featuring detailed valuation calculations.
- Real-World Data: Sinfonia Technology Co., Ltd.'s historical and projected financials preloaded for comprehensive analysis.
- Customizable Parameters: Modify WACC, growth rates, and tax assumptions to explore various scenarios.
- Financial Statements: Complete annual and quarterly breakdowns for enhanced insights.
- Key Ratios: Integrated analysis for profitability, efficiency, and leverage metrics.
- Dashboard with Visual Outputs: Graphs and tables to present clear, actionable insights.
Disclaimer
All information, articles, and product details provided on this website are for general informational and educational purposes only. We do not claim any ownership over, nor do we intend to infringe upon, any trademarks, copyrights, logos, brand names, or other intellectual property mentioned or depicted on this site. Such intellectual property remains the property of its respective owners, and any references here are made solely for identification or informational purposes, without implying any affiliation, endorsement, or partnership.
We make no representations or warranties, express or implied, regarding the accuracy, completeness, or suitability of any content or products presented. Nothing on this website should be construed as legal, tax, investment, financial, medical, or other professional advice. In addition, no part of this site—including articles or product references—constitutes a solicitation, recommendation, endorsement, advertisement, or offer to buy or sell any securities, franchises, or other financial instruments, particularly in jurisdictions where such activity would be unlawful.
All content is of a general nature and may not address the specific circumstances of any individual or entity. It is not a substitute for professional advice or services. Any actions you take based on the information provided here are strictly at your own risk. You accept full responsibility for any decisions or outcomes arising from your use of this website and agree to release us from any liability in connection with your use of, or reliance upon, the content or products found herein.