
|
NEC Corporation (6701.T) DCF Valoración |
Completamente Editable: Adáptelo A Sus Necesidades En Excel O Sheets
Diseño Profesional: Plantillas Confiables Y Estándares De La Industria
Predeterminadas Para Un Uso Rápido Y Eficiente
Compatible con MAC / PC, completamente desbloqueado
No Se Necesita Experiencia; Fáciles De Seguir
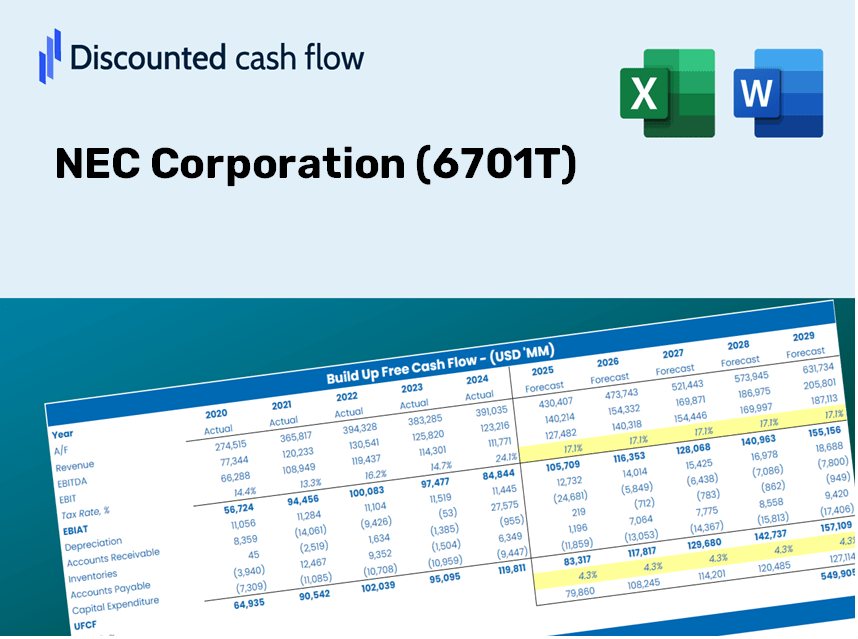
NEC Corporation (6701.T) Bundle
¿Busca determinar el valor intrínseco de NEC Corporation? Nuestra calculadora DCF (6701T) integra datos reales con extensas características de personalización, lo que le permite refinar sus pronósticos y mejorar sus opciones de inversión.
What You Will Receive
- Customizable Excel Template: A fully editable Excel-based DCF Calculator featuring pre-populated financial data for NEC Corporation (6701T).
- Accurate Financial Data: Access to historical figures and forward-looking projections (highlighted in the yellow cells).
- Flexible Forecasting: Adjust key assumptions such as revenue growth, EBITDA margin, and WACC.
- Instant Calculations: Quickly observe how your inputs influence the valuation of NEC Corporation (6701T).
- Professional Standard: Designed for investors, CFOs, consultants, and financial analysts.
- User-Friendly Interface: Organized for straightforward navigation and ease of use, complete with step-by-step guidance.
Key Features
- 🔍 Real-Life NEC Financials: Pre-filled historical and projected data for NEC Corporation (6701T).
- ✏️ Fully Customizable Inputs: Modify all essential parameters (yellow cells) such as WACC, growth %, and tax rates.
- 📊 Professional DCF Valuation: Integrated formulas to compute NEC's intrinsic value using the Discounted Cash Flow method.
- ⚡ Instant Results: Visualize NEC's valuation immediately after adjustments.
- Scenario Analysis: Evaluate and contrast outcomes for different financial assumptions side-by-side.
How It Works
- Step 1: Download the Excel file.
- Step 2: Review the pre-filled NEC Corporation (6701T) data, including historical and projected figures.
- Step 3: Modify key assumptions (highlighted in yellow) based on your analysis.
- Step 4: Observe real-time recalculations for NEC Corporation’s (6701T) intrinsic value.
- Step 5: Utilize the results for your investment decisions or reports.
Why Choose the NEC Corporation Calculator?
- User-Friendly Interface: Crafted for both novices and seasoned professionals.
- Customizable Inputs: Effortlessly adjust parameters to suit your specific evaluation.
- Real-Time Feedback: Observe immediate updates to NEC’s valuation as you change inputs.
- Pre-Configured: Comes with NEC’s current financial metrics for swift assessments.
- Relied Upon by Experts: Utilized by investors and analysts for informed decision-making.
Who Should Use This Product?
- Investors: Accurately assess NEC Corporation’s (6701T) fair value prior to making investment decisions.
- CFOs: Utilize a professional-grade DCF model for financial reporting and analysis at NEC Corporation (6701T).
- Consultants: Easily customize the template for valuation reports tailored to NEC Corporation (6701T) clients.
- Entrepreneurs: Discover insights into financial modeling practices employed by leading firms like NEC Corporation (6701T).
- Educators: Employ it as a teaching resource to illustrate various valuation methodologies relevant to NEC Corporation (6701T).
Contents of the Template
- Operating and Balance Sheet Data: Historical data and forecasts for NEC Corporation (6701T), including revenue, EBITDA, EBIT, and capital expenditures.
- WACC Calculation: A separate sheet dedicated to calculating the Weighted Average Cost of Capital (WACC), featuring inputs such as Beta, risk-free rate, and share price.
- DCF Valuation (Unlevered and Levered): Customizable Discounted Cash Flow models illustrating intrinsic value alongside comprehensive calculations.
- Financial Statements: Pre-loaded financial statements (both annual and quarterly) to aid in your analysis.
- Key Ratios: A collection of profitability, leverage, and efficiency ratios pertinent to NEC Corporation (6701T).
- Dashboard and Charts: A visual representation of valuation results and assumptions for straightforward analysis.
Disclaimer
All information, articles, and product details provided on this website are for general informational and educational purposes only. We do not claim any ownership over, nor do we intend to infringe upon, any trademarks, copyrights, logos, brand names, or other intellectual property mentioned or depicted on this site. Such intellectual property remains the property of its respective owners, and any references here are made solely for identification or informational purposes, without implying any affiliation, endorsement, or partnership.
We make no representations or warranties, express or implied, regarding the accuracy, completeness, or suitability of any content or products presented. Nothing on this website should be construed as legal, tax, investment, financial, medical, or other professional advice. In addition, no part of this site—including articles or product references—constitutes a solicitation, recommendation, endorsement, advertisement, or offer to buy or sell any securities, franchises, or other financial instruments, particularly in jurisdictions where such activity would be unlawful.
All content is of a general nature and may not address the specific circumstances of any individual or entity. It is not a substitute for professional advice or services. Any actions you take based on the information provided here are strictly at your own risk. You accept full responsibility for any decisions or outcomes arising from your use of this website and agree to release us from any liability in connection with your use of, or reliance upon, the content or products found herein.