
|
Sun Corporation (6736.T) Valoración de DCF |
Completamente Editable: Adáptelo A Sus Necesidades En Excel O Sheets
Diseño Profesional: Plantillas Confiables Y Estándares De La Industria
Predeterminadas Para Un Uso Rápido Y Eficiente
Compatible con MAC / PC, completamente desbloqueado
No Se Necesita Experiencia; Fáciles De Seguir
Sun Corporation (6736.T) Bundle
¿Busca evaluar el valor intrínseco de Sun Corporation? Nuestra calculadora DCF (6736T) integra datos del mundo real con características integrales de personalización, lo que le permite refinar sus pronósticos y tomar decisiones de inversión más informadas.
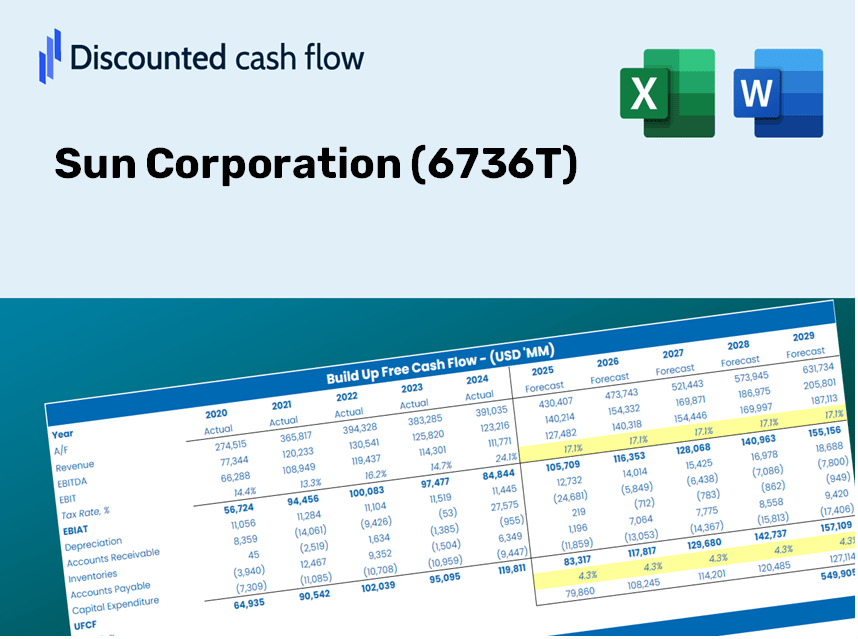
Discounted Cash Flow (DCF) - (USD MM)
| Year | AY1 2021 |
AY2 2022 |
AY3 2023 |
AY4 2024 |
AY5 2025 |
FY1 2026 |
FY2 2027 |
FY3 2028 |
FY4 2029 |
FY5 2030 |
|---|---|---|---|---|---|---|---|---|---|---|
| Revenue | 26,662.8 | 37,205.4 | 37,449.1 | 10,045.6 | 10,837.2 | 10,157.2 | 9,519.8 | 8,922.4 | 8,362.6 | 7,837.8 |
| Revenue Growth, % | 0 | 39.54 | 0.6549 | -73.18 | 7.88 | -6.27 | -6.27 | -6.27 | -6.27 | -6.27 |
| EBITDA | 1,752.1 | 10,843.1 | 15,509.3 | -3,810.3 | 18,296.9 | 2,827.8 | 2,650.3 | 2,484.0 | 2,328.1 | 2,182.0 |
| EBITDA, % | 6.57 | 29.14 | 41.41 | -37.93 | 168.83 | 27.84 | 27.84 | 27.84 | 27.84 | 27.84 |
| Depreciation | 823.3 | 1,142.1 | 1,533.7 | 299.6 | 325.5 | 329.9 | 309.2 | 289.8 | 271.6 | 254.6 |
| Depreciation, % | 3.09 | 3.07 | 4.1 | 2.98 | 3 | 3.25 | 3.25 | 3.25 | 3.25 | 3.25 |
| EBIT | 928.8 | 9,701.0 | 13,975.6 | -4,109.9 | 17,971.4 | 2,558.9 | 2,398.3 | 2,247.8 | 2,106.8 | 1,974.6 |
| EBIT, % | 3.48 | 26.07 | 37.32 | -40.91 | 165.83 | 25.19 | 25.19 | 25.19 | 25.19 | 25.19 |
| Total Cash | 32,534.3 | 32,782.7 | 3,183.8 | 1,732.0 | 9,948.5 | 6,209.2 | 5,819.6 | 5,454.4 | 5,112.1 | 4,791.3 |
| Total Cash, percent | .0 | .0 | .0 | .0 | .0 | .0 | .0 | .0 | .0 | .0 |
| Account Receivables | 8,731.8 | 35,510.5 | 6,442.2 | 1,899.1 | 1,972.5 | 3,707.4 | 3,474.8 | 3,256.7 | 3,052.4 | 2,860.8 |
| Account Receivables, % | 32.75 | 95.44 | 17.2 | 18.9 | 18.2 | 36.5 | 36.5 | 36.5 | 36.5 | 36.5 |
| Inventories | 1,126.0 | 2,140.0 | 2,715.4 | 4,903.9 | 4,127.3 | 2,115.3 | 1,982.5 | 1,858.1 | 1,741.5 | 1,632.2 |
| Inventories, % | 4.22 | 5.75 | 7.25 | 48.82 | 38.08 | 20.83 | 20.83 | 20.83 | 20.83 | 20.83 |
| Accounts Payable | 1,528.5 | 2,360.3 | 2,411.1 | 1,989.2 | 881.0 | 943.5 | 884.3 | 828.8 | 776.8 | 728.1 |
| Accounts Payable, % | 5.73 | 6.34 | 6.44 | 19.8 | 8.13 | 9.29 | 9.29 | 9.29 | 9.29 | 9.29 |
| Capital Expenditure | -682.9 | -1,138.4 | -1,048.0 | -288.3 | -248.4 | -275.9 | -258.6 | -242.4 | -227.2 | -212.9 |
| Capital Expenditure, % | -2.56 | -3.06 | -2.8 | -2.87 | -2.29 | -2.72 | -2.72 | -2.72 | -2.72 | -2.72 |
| Tax Rate, % | 4.01 | 4.01 | 4.01 | 4.01 | 4.01 | 4.01 | 4.01 | 4.01 | 4.01 | 4.01 |
| EBITAT | 49.4 | 2,825.2 | 6,885.9 | -3,768.7 | 17,251.4 | 1,389.0 | 1,301.8 | 1,220.2 | 1,143.6 | 1,071.8 |
| Depreciation | ||||||||||
| Changes in Account Receivables | ||||||||||
| Changes in Inventories | ||||||||||
| Changes in Accounts Payable | ||||||||||
| Capital Expenditure | ||||||||||
| UFCF | -8,139.5 | -24,132.0 | 35,915.2 | -1,824.6 | 16,923.3 | 1,782.7 | 1,658.6 | 1,554.5 | 1,457.0 | 1,365.5 |
| WACC, % | 8.6 | 8.61 | 8.61 | 8.63 | 8.63 | 8.62 | 8.62 | 8.62 | 8.62 | 8.62 |
| PV UFCF | ||||||||||
| SUM PV UFCF | 6,210.3 | |||||||||
| Long Term Growth Rate, % | 2.00 | |||||||||
| Free cash flow (T + 1) | 1,393 | |||||||||
| Terminal Value | 21,051 | |||||||||
| Present Terminal Value | 13,925 | |||||||||
| Enterprise Value | 20,135 | |||||||||
| Net Debt | -7,403 | |||||||||
| Equity Value | 27,538 | |||||||||
| Diluted Shares Outstanding, MM | 22 | |||||||||
| Equity Value Per Share | 1,235.03 |
What You Will Receive
- Genuine SUN Financials: Incorporates both historical and projected data for precise valuation.
- Customizable Parameters: Adjust WACC, tax rates, revenue growth, and capital investments as needed.
- Automated Calculations: Intrinsic value and NPV are computed in real-time.
- Scenario Planning: Explore various scenarios to assess Sun Corporation's future performance.
- User-Friendly Design: Designed for professionals while remaining approachable for newcomers.
Key Features
- Real-Life SUN Data: Pre-filled with Sun Corporation’s historical financials and forward-looking projections.
- Fully Customizable Inputs: Modify revenue growth, margins, WACC, tax rates, and capital expenditures to fit your analysis.
- Dynamic Valuation Model: Automatically refreshes Net Present Value (NPV) and intrinsic value as you adjust your inputs.
- Scenario Testing: Develop multiple forecasting scenarios to evaluate various valuation outcomes.
- User-Friendly Design: Intuitive and structured, catering to both professionals and newcomers.
How It Functions
- Download: Obtain the pre-built Excel file featuring Sun Corporation's (6736T) financial data.
- Customize: Modify forecasts, such as revenue growth, EBITDA %, and WACC as per your requirements.
- Update Automatically: Watch the intrinsic value and NPV calculations refresh in real-time.
- Test Scenarios: Generate various projections and instantly compare the results.
- Make Decisions: Utilize the valuation findings to inform your investment strategy.
Why Opt for the Sun Corporation (6736T) Calculator?
- Time-Saving: Skip the hassle of building a DCF model from the ground up – it’s ready for immediate use.
- Enhanced Precision: Dependable financial data and formulas minimize valuation errors.
- Completely Customizable: Adjust the model to align with your unique assumptions and forecasts.
- Simple to Analyze: Intuitive charts and outputs facilitate easy interpretation of results.
- Endorsed by Professionals: Crafted for experts who prioritize accuracy and user-friendliness.
Who Can Benefit from This Product?
- Investors: Gain accurate estimations of Sun Corporation’s (6736T) fair value to inform your investment choices.
- CFOs: Utilize a sophisticated DCF model for enhanced financial reporting and analysis involving Sun Corporation (6736T).
- Consultants: Effortlessly customize the template for creating valuation reports tailored to your clients regarding Sun Corporation (6736T).
- Entrepreneurs: Discover valuable insights into the financial modeling techniques employed by leading companies like Sun Corporation (6736T).
- Educators: Employ this resource as a teaching tool to illustrate various valuation methodologies using Sun Corporation (6736T) as a case study.
Contents of the Template
- Pre-Filled DCF Model: Sun Corporation’s financial data preloaded for immediate application.
- WACC Calculator: In-depth calculations for the Weighted Average Cost of Capital.
- Financial Ratios: Assess Sun Corporation's profitability, leverage, and operational efficiency.
- Editable Inputs: Modify assumptions such as growth rates, profit margins, and CAPEX to tailor your scenarios.
- Financial Statements: Access annual and quarterly reports for comprehensive analysis.
- Interactive Dashboard: Effortlessly visualize essential valuation metrics and outcomes.
Disclaimer
All information, articles, and product details provided on this website are for general informational and educational purposes only. We do not claim any ownership over, nor do we intend to infringe upon, any trademarks, copyrights, logos, brand names, or other intellectual property mentioned or depicted on this site. Such intellectual property remains the property of its respective owners, and any references here are made solely for identification or informational purposes, without implying any affiliation, endorsement, or partnership.
We make no representations or warranties, express or implied, regarding the accuracy, completeness, or suitability of any content or products presented. Nothing on this website should be construed as legal, tax, investment, financial, medical, or other professional advice. In addition, no part of this site—including articles or product references—constitutes a solicitation, recommendation, endorsement, advertisement, or offer to buy or sell any securities, franchises, or other financial instruments, particularly in jurisdictions where such activity would be unlawful.
All content is of a general nature and may not address the specific circumstances of any individual or entity. It is not a substitute for professional advice or services. Any actions you take based on the information provided here are strictly at your own risk. You accept full responsibility for any decisions or outcomes arising from your use of this website and agree to release us from any liability in connection with your use of, or reliance upon, the content or products found herein.