
|
Alps Alpine Co., Ltd. (6770.T) Valoración de DCF |
Completamente Editable: Adáptelo A Sus Necesidades En Excel O Sheets
Diseño Profesional: Plantillas Confiables Y Estándares De La Industria
Predeterminadas Para Un Uso Rápido Y Eficiente
Compatible con MAC / PC, completamente desbloqueado
No Se Necesita Experiencia; Fáciles De Seguir
Alps Alpine Co., Ltd. (6770.T) Bundle
¡Agilice su análisis y mejore la precisión con nuestra calculadora DCF (6770T)! Equipado con datos Alps Alpine Co., Ltd. y suposiciones personalizables en tiempo real, esta herramienta le permite pronosticar, analizar y valorar Alps Alpine Co., Ltd. como un inversor experto.
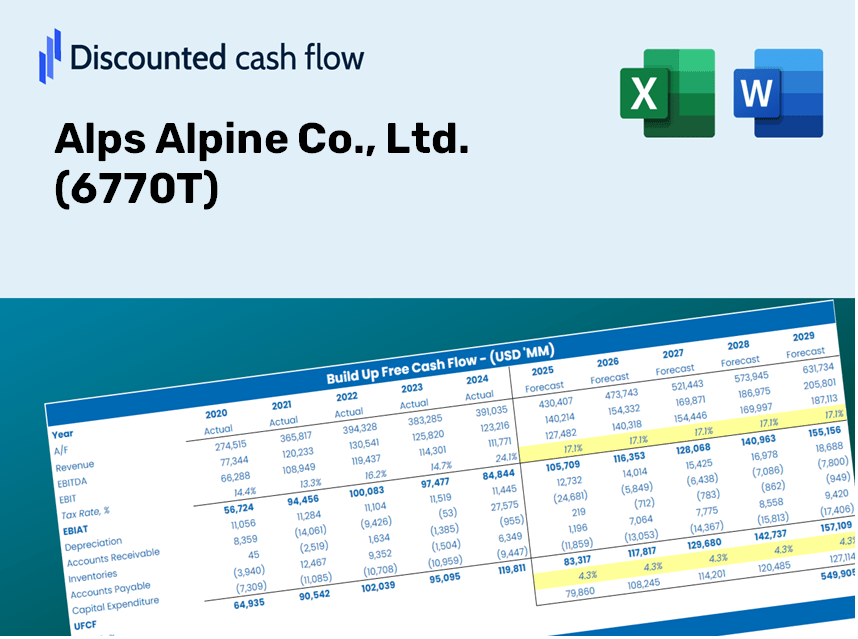
Discounted Cash Flow (DCF) - (USD MM)
| Year | AY1 2020 |
AY2 2021 |
AY3 2022 |
AY4 2023 |
AY5 2024 |
FY1 2025 |
FY2 2026 |
FY3 2027 |
FY4 2028 |
FY5 2029 |
|---|---|---|---|---|---|---|---|---|---|---|
| Revenue | 718,013.0 | 802,854.0 | 933,114.0 | 964,090.0 | 990,407.0 | 1,074,814.6 | 1,166,415.8 | 1,265,823.8 | 1,373,703.8 | 1,490,777.9 |
| Revenue Growth, % | 0 | 11.82 | 16.22 | 3.32 | 2.73 | 8.52 | 8.52 | 8.52 | 8.52 | 8.52 |
| EBITDA | 47,103.0 | 85,092.0 | 74,879.0 | 28,104.0 | 94,057.0 | 80,816.2 | 87,703.7 | 95,178.3 | 103,289.9 | 112,092.8 |
| EBITDA, % | 6.56 | 10.6 | 8.02 | 2.92 | 9.5 | 7.52 | 7.52 | 7.52 | 7.52 | 7.52 |
| Depreciation | 41,336.0 | 45,705.0 | 46,836.0 | 41,464.0 | 35,143.0 | 52,275.4 | 56,730.5 | 61,565.4 | 66,812.3 | 72,506.4 |
| Depreciation, % | 5.76 | 5.69 | 5.02 | 4.3 | 3.55 | 4.86 | 4.86 | 4.86 | 4.86 | 4.86 |
| EBIT | 5,767.0 | 39,387.0 | 28,043.0 | -13,360.0 | 58,914.0 | 28,540.8 | 30,973.2 | 33,612.9 | 36,477.5 | 39,586.3 |
| EBIT, % | 0.80319 | 4.91 | 3.01 | -1.39 | 5.95 | 2.66 | 2.66 | 2.66 | 2.66 | 2.66 |
| Total Cash | 153,067.0 | 139,730.0 | 84,173.0 | 122,667.0 | 147,941.0 | 162,090.5 | 175,904.7 | 190,896.2 | 207,165.4 | 224,821.1 |
| Total Cash, percent | .0 | .0 | .0 | .0 | .0 | .0 | .0 | .0 | .0 | .0 |
| Account Receivables | 147,963.0 | 156,289.0 | 176,711.0 | 158,292.0 | 164,915.0 | 197,941.7 | 214,811.3 | 233,118.6 | 252,986.2 | 274,546.9 |
| Account Receivables, % | 20.61 | 19.47 | 18.94 | 16.42 | 16.65 | 18.42 | 18.42 | 18.42 | 18.42 | 18.42 |
| Inventories | 95,777.0 | 133,400.0 | 165,424.0 | 163,715.0 | 138,634.0 | 169,094.2 | 183,505.3 | 199,144.6 | 216,116.7 | 234,535.3 |
| Inventories, % | 13.34 | 16.62 | 17.73 | 16.98 | 14 | 15.73 | 15.73 | 15.73 | 15.73 | 15.73 |
| Accounts Payable | 79,932.0 | 85,243.0 | 98,547.0 | 93,964.0 | 90,381.0 | 110,024.5 | 119,401.3 | 129,577.3 | 140,620.6 | 152,605.0 |
| Accounts Payable, % | 11.13 | 10.62 | 10.56 | 9.75 | 9.13 | 10.24 | 10.24 | 10.24 | 10.24 | 10.24 |
| Capital Expenditure | -37,964.0 | -48,196.0 | -52,356.0 | -56,041.0 | -43,036.0 | -58,167.8 | -63,125.2 | -68,505.0 | -74,343.4 | -80,679.3 |
| Capital Expenditure, % | -5.29 | -6 | -5.61 | -5.81 | -4.35 | -5.41 | -5.41 | -5.41 | -5.41 | -5.41 |
| Tax Rate, % | 34.62 | 34.62 | 34.62 | 34.62 | 34.62 | 34.62 | 34.62 | 34.62 | 34.62 | 34.62 |
| EBITAT | -4,422.1 | 23,386.9 | 11,996.6 | -27,513.6 | 38,518.3 | 15,271.4 | 16,573.0 | 17,985.4 | 19,518.2 | 21,181.6 |
| Depreciation | ||||||||||
| Changes in Account Receivables | ||||||||||
| Changes in Inventories | ||||||||||
| Changes in Accounts Payable | ||||||||||
| Capital Expenditure | ||||||||||
| UFCF | -164,858.1 | -19,742.1 | -32,665.4 | -26,545.6 | 45,500.3 | -34,464.4 | -11,725.5 | -12,724.8 | -13,809.3 | -14,986.2 |
| WACC, % | 4.5 | 4.95 | 4.82 | 5.25 | 4.99 | 4.9 | 4.9 | 4.9 | 4.9 | 4.9 |
| PV UFCF | ||||||||||
| SUM PV UFCF | -77,729.5 | |||||||||
| Long Term Growth Rate, % | 2.00 | |||||||||
| Free cash flow (T + 1) | -15,286 | |||||||||
| Terminal Value | -526,419 | |||||||||
| Present Terminal Value | -414,359 | |||||||||
| Enterprise Value | -492,088 | |||||||||
| Net Debt | -47,154 | |||||||||
| Equity Value | -444,934 | |||||||||
| Diluted Shares Outstanding, MM | 206 | |||||||||
| Equity Value Per Share | -2,163.62 |
What You Will Receive
- Authentic Alps Alpine Data: Preloaded financials – including revenue and EBIT – derived from actual and forecasted figures.
- Comprehensive Customization: Modify all key parameters (yellow cells) such as WACC, growth %, and tax rates.
- Immediate Valuation Adjustments: Automatic recalculations to evaluate the effects of changes on the fair value of Alps Alpine (6770T).
- Adaptable Excel Template: Designed for quick modifications, scenario analyses, and in-depth projections.
- Efficient and Precise: Avoid starting from scratch while ensuring accuracy and adaptability in your analysis.
Key Features
- 🔍 Real-Life ALPS Financials: Access pre-filled historical and projected data for Alps Alpine Co., Ltd. (6770T).
- ✏️ Fully Customizable Inputs: Modify all essential parameters (yellow cells) such as WACC, growth %, and tax rates.
- 📊 Professional DCF Valuation: Utilize built-in formulas to calculate the intrinsic value of Alps Alpine using the Discounted Cash Flow method.
- ⚡ Instant Results: Visualize the valuation of Alps Alpine immediately after making adjustments.
- Scenario Analysis: Analyze and compare outcomes for various financial assumptions in a side-by-side format.
How It Works
- Download: Access the ready-to-use Excel file featuring Alps Alpine Co., Ltd.'s (6770T) financial data.
- Customize: Tailor your forecasts, including revenue growth, EBITDA %, and WACC for Alps Alpine Co., Ltd. (6770T).
- Update Automatically: Enjoy real-time updates for intrinsic value and NPV calculations.
- Test Scenarios: Build multiple projections and instantly compare outcomes for Alps Alpine Co., Ltd. (6770T).
- Make Decisions: Leverage the valuation results to inform your investment strategy for Alps Alpine Co., Ltd. (6770T).
Why Select This Calculator for Alps Alpine Co., Ltd. (6770T)?
- All-in-One Solution: Features DCF, WACC, and various financial ratio analyses seamlessly integrated.
- Flexible Inputs: Modify the yellow-highlighted fields to explore different scenarios.
- In-Depth Analysis: Automatically computes the intrinsic value and Net Present Value for Alps Alpine Co., Ltd. (6770T).
- Preloaded Information: Access historical and projected data for reliable benchmarks.
- High-Quality Standards: Perfect for financial analysts, investors, and business consultants looking to evaluate Alps Alpine Co., Ltd. (6770T).
Who Can Benefit from Alps Alpine Co., Ltd. (6770T)?
- Investors: Gain insight and make informed choices with our advanced valuation tool tailored for Alps Alpine Co., Ltd. (6770T).
- Financial Analysts: Enhance efficiency with our ready-to-customize DCF model specific to Alps Alpine Co., Ltd. (6770T).
- Consultants: Seamlessly modify the template for impactful client presentations or detailed reports focused on Alps Alpine Co., Ltd. (6770T).
- Finance Enthusiasts: Expand your knowledge of valuation methods with practical examples from Alps Alpine Co., Ltd. (6770T).
- Educators and Students: Utilize this resource as a hands-on learning tool for finance courses centered on Alps Alpine Co., Ltd. (6770T).
Contents of the Template
- Operating and Balance Sheet Data: Pre-filled historical data and projections for Alps Alpine Co., Ltd. (6770T), including metrics such as revenue, EBITDA, EBIT, and capital expenditures.
- WACC Calculation: A specialized sheet for calculating the Weighted Average Cost of Capital (WACC), featuring key parameters like Beta, risk-free rate, and share price.
- DCF Valuation (Unlevered and Levered): Customizable Discounted Cash Flow models providing intrinsic value assessments backed by comprehensive calculations.
- Financial Statements: Pre-loaded annual and quarterly financial statements to aid in detailed analysis.
- Key Ratios: A collection of profitability, leverage, and efficiency ratios specifically for Alps Alpine Co., Ltd. (6770T).
- Dashboard and Charts: An interactive visual summary of valuation results and underlying assumptions for easy analysis.
Disclaimer
All information, articles, and product details provided on this website are for general informational and educational purposes only. We do not claim any ownership over, nor do we intend to infringe upon, any trademarks, copyrights, logos, brand names, or other intellectual property mentioned or depicted on this site. Such intellectual property remains the property of its respective owners, and any references here are made solely for identification or informational purposes, without implying any affiliation, endorsement, or partnership.
We make no representations or warranties, express or implied, regarding the accuracy, completeness, or suitability of any content or products presented. Nothing on this website should be construed as legal, tax, investment, financial, medical, or other professional advice. In addition, no part of this site—including articles or product references—constitutes a solicitation, recommendation, endorsement, advertisement, or offer to buy or sell any securities, franchises, or other financial instruments, particularly in jurisdictions where such activity would be unlawful.
All content is of a general nature and may not address the specific circumstances of any individual or entity. It is not a substitute for professional advice or services. Any actions you take based on the information provided here are strictly at your own risk. You accept full responsibility for any decisions or outcomes arising from your use of this website and agree to release us from any liability in connection with your use of, or reliance upon, the content or products found herein.