
|
Shenwan Hongyuan Group Co., Ltd. (6806.hk) Valoración de DCF |
Completamente Editable: Adáptelo A Sus Necesidades En Excel O Sheets
Diseño Profesional: Plantillas Confiables Y Estándares De La Industria
Predeterminadas Para Un Uso Rápido Y Eficiente
Compatible con MAC / PC, completamente desbloqueado
No Se Necesita Experiencia; Fáciles De Seguir
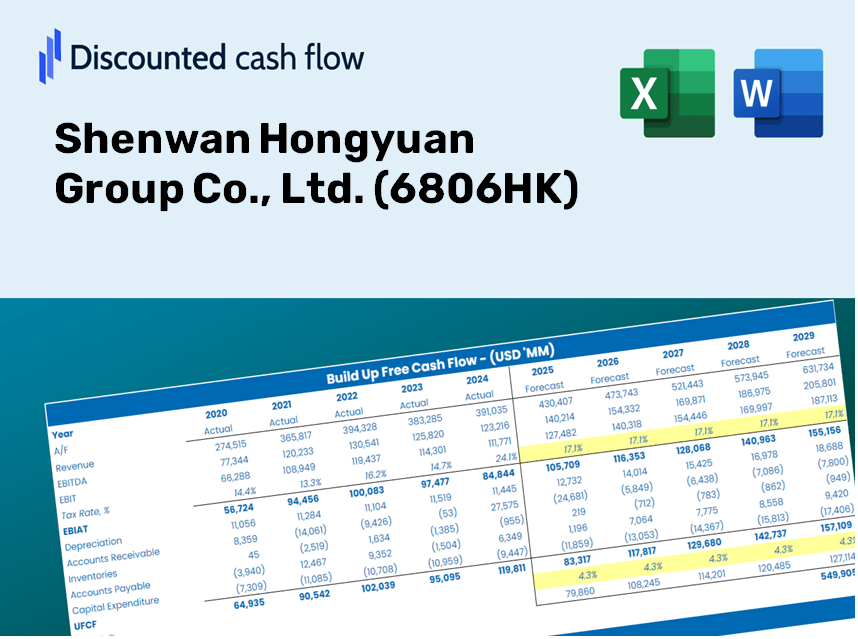
Shenwan Hongyuan Group Co., Ltd. (6806.HK) Bundle
¡Agilice su análisis y mejore la precisión con nuestra calculadora DCF (6806HK)! Utilizando datos reales de Shenwan Hongyuan Group Co., Ltd. y suposiciones personalizables, esta herramienta le permite pronosticar, analizar y valor (6806HK) al igual que un inversor experimentado.
Benefits You Will Receive
- Adjustable Forecast Parameters: Effortlessly modify assumptions (growth %, margins, WACC) to explore various scenarios.
- Real-Time Financial Data: Pre-filled financial information for Shenwan Hongyuan Group Co., Ltd. (6806HK) to kickstart your analysis.
- Automated DCF Calculations: The template generates the Net Present Value (NPV) and intrinsic value automatically.
- Customizable and Professional Design: A refined Excel model tailored to meet your valuation requirements.
- Designed for Analysts and Investors: Perfect for evaluating projections, confirming strategies, and optimizing time.
Key Features
- Authentic Financial Data: Access reliable historical data and future forecasts for Shenwan Hongyuan Group Co., Ltd. (6806HK).
- Customizable Forecast Parameters: Modify highlighted fields such as WACC, growth rates, and profit margins.
- Real-Time Calculations: Automatic updates to DCF, Net Present Value (NPV), and cash flow evaluations.
- User-Friendly Dashboard: Clear and concise charts and summaries to help you interpret your valuation findings.
- Designed for All Experience Levels: A straightforward, intuitive layout tailored for investors, CFOs, and consultants alike.
How It Functions
- Download the Template: Gain immediate access to the Excel-based SHYG DCF Calculator.
- Input Your Assumptions: Modify the yellow-highlighted cells for growth rates, WACC, margins, and more.
- Instant Calculations: The model automatically calculates the intrinsic value of Shenwan Hongyuan Group Co., Ltd. (6806HK).
- Test Scenarios: Experiment with various assumptions to see how they affect the valuation.
- Analyze and Decide: Use the outcomes to inform your investment or financial analysis.
Why Opt for the Shenwan Hongyuan Calculator?
- Reliability: Utilizes authentic Shenwan Hongyuan financial data for trustworthy information.
- Customizability: Built to allow users to easily experiment and adjust their parameters.
- Efficiency: Eliminate the labor of creating a financial model from the ground up.
- Expert Quality: Crafted with the precision and usability expected at the executive level.
- User-Centric: Designed for simplicity, making it accessible for users with varying levels of financial expertise.
Who Should Utilize This Service?
- Individual Investors: Make informed decisions regarding the purchase or sale of Shenwan Hongyuan Group Co., Ltd. (6806HK) shares.
- Financial Analysts: Enhance valuation processes with ready-to-use financial models tailored for Shenwan Hongyuan Group Co., Ltd. (6806HK).
- Consultants: Provide accurate valuation insights for clients promptly, focusing on Shenwan Hongyuan Group Co., Ltd. (6806HK).
- Business Owners: Gain insights into how valuations are determined for firms like Shenwan Hongyuan Group Co., Ltd. (6806HK) to inform your own business strategies.
- Finance Students: Master valuation techniques through the analysis of real-world data and case studies involving Shenwan Hongyuan Group Co., Ltd. (6806HK).
What the Template Includes
- Historical Data: Provides Shenwan Hongyuan Group Co., Ltd.'s (6806HK) previous financials and foundational forecasts.
- DCF and Levered DCF Models: Comprehensive templates for calculating the intrinsic value of Shenwan Hongyuan Group Co., Ltd. (6806HK).
- WACC Sheet: Ready-to-use calculations for the Weighted Average Cost of Capital.
- Editable Inputs: Adjust crucial variables such as growth rates, EBITDA %, and CAPEX assumptions.
- Quarterly and Annual Financial Statements: An extensive breakdown of Shenwan Hongyuan Group Co., Ltd.'s (6806HK) financial data.
- Interactive Dashboard: Dynamically visualize valuation results and projections.
Disclaimer
All information, articles, and product details provided on this website are for general informational and educational purposes only. We do not claim any ownership over, nor do we intend to infringe upon, any trademarks, copyrights, logos, brand names, or other intellectual property mentioned or depicted on this site. Such intellectual property remains the property of its respective owners, and any references here are made solely for identification or informational purposes, without implying any affiliation, endorsement, or partnership.
We make no representations or warranties, express or implied, regarding the accuracy, completeness, or suitability of any content or products presented. Nothing on this website should be construed as legal, tax, investment, financial, medical, or other professional advice. In addition, no part of this site—including articles or product references—constitutes a solicitation, recommendation, endorsement, advertisement, or offer to buy or sell any securities, franchises, or other financial instruments, particularly in jurisdictions where such activity would be unlawful.
All content is of a general nature and may not address the specific circumstances of any individual or entity. It is not a substitute for professional advice or services. Any actions you take based on the information provided here are strictly at your own risk. You accept full responsibility for any decisions or outcomes arising from your use of this website and agree to release us from any liability in connection with your use of, or reliance upon, the content or products found herein.