
|
Ascentage Pharma Group International (6855.HK) Valoración de DCF |
Completamente Editable: Adáptelo A Sus Necesidades En Excel O Sheets
Diseño Profesional: Plantillas Confiables Y Estándares De La Industria
Predeterminadas Para Un Uso Rápido Y Eficiente
Compatible con MAC / PC, completamente desbloqueado
No Se Necesita Experiencia; Fáciles De Seguir
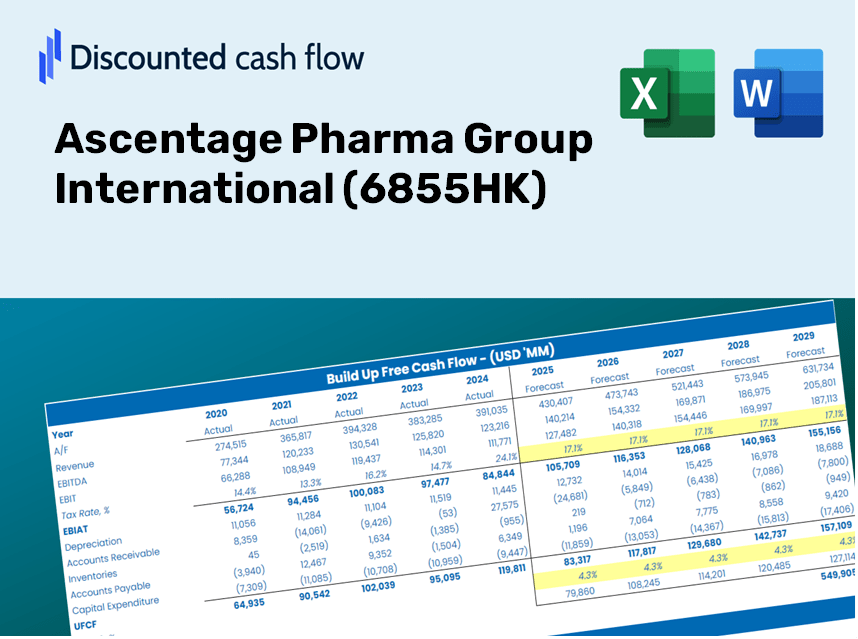
Ascentage Pharma Group International (6855.HK) Bundle
¡Evalúe la perspectiva financiera de Ascentage Pharma Group International como un experto! Esta calculadora DCF (6855HK) proporciona datos financieros previamente rellenos junto con una flexibilidad total para modificar el crecimiento de los ingresos, WACC, los márgenes y otros supuestos críticos para alinearse con sus proyecciones.
Discounted Cash Flow (DCF) - (USD MM)
| Year | AY1 2020 |
AY2 2021 |
AY3 2022 |
AY4 2023 |
AY5 2024 |
FY1 2025 |
FY2 2026 |
FY3 2027 |
FY4 2028 |
FY5 2029 |
|---|---|---|---|---|---|---|---|---|---|---|
| Revenue | 13.6 | 30.5 | 229.1 | 242.5 | 1,071.3 | 1,890.4 | 3,335.9 | 5,886.6 | 10,387.7 | 18,330.4 |
| Revenue Growth, % | 0 | 124.18 | 651.38 | 5.85 | 341.77 | 76.46 | 76.46 | 76.46 | 76.46 | 76.46 |
| EBITDA | -701.1 | -1,000.6 | -913.2 | -812.3 | -327.3 | -1,627.9 | -2,872.6 | -5,069.0 | -8,944.9 | -15,784.5 |
| EBITDA, % | -5154.79 | -3281.93 | -398.64 | -334.98 | -30.55 | -86.11 | -86.11 | -86.11 | -86.11 | -86.11 |
| Depreciation | 30.0 | 18.8 | 51.8 | 101.8 | 86.5 | 885.6 | 1,562.8 | 2,757.7 | 4,866.3 | 8,587.2 |
| Depreciation, % | 220.26 | 61.57 | 22.61 | 41.98 | 8.07 | 46.85 | 46.85 | 46.85 | 46.85 | 46.85 |
| EBIT | -731.0 | -1,019.4 | -965.1 | -914.1 | -413.8 | -1,658.4 | -2,926.4 | -5,164.1 | -9,112.6 | -16,080.5 |
| EBIT, % | -5375.04 | -3343.5 | -421.25 | -376.97 | -38.63 | -87.73 | -87.73 | -87.73 | -87.73 | -87.73 |
| Total Cash | 1,122.4 | 1,909.5 | 1,643.2 | 1,202.1 | 1,377.8 | 1,890.4 | 3,335.9 | 5,886.6 | 10,387.7 | 18,330.4 |
| Total Cash, percent | .0 | .0 | .0 | .0 | .0 | .0 | .0 | .0 | .0 | .0 |
| Account Receivables | .5 | 59.0 | 59.4 | 159.4 | 90.8 | 771.2 | 1,360.9 | 2,401.4 | 4,237.7 | 7,477.9 |
| Account Receivables, % | 3.86 | 193.36 | 25.92 | 65.72 | 8.48 | 40.8 | 40.8 | 40.8 | 40.8 | 40.8 |
| Inventories | .0 | 4.3 | 10.3 | 17.7 | 7.2 | 100.4 | 177.1 | 312.5 | 551.4 | 973.0 |
| Inventories, % | 0 | 14.08 | 4.51 | 7.28 | 0.67272 | 5.31 | 5.31 | 5.31 | 5.31 | 5.31 |
| Accounts Payable | 25.5 | 77.4 | 104.4 | 79.1 | 100.5 | 1,087.3 | 1,918.7 | 3,385.7 | 5,974.6 | 10,542.9 |
| Accounts Payable, % | 187.64 | 253.89 | 45.57 | 32.64 | 9.38 | 57.52 | 57.52 | 57.52 | 57.52 | 57.52 |
| Capital Expenditure | -273.0 | -475.7 | -222.1 | -62.1 | -26.5 | -1,228.8 | -2,168.5 | -3,826.5 | -6,752.4 | -11,915.6 |
| Capital Expenditure, % | -2007.4 | -1560.07 | -96.94 | -25.61 | -2.48 | -65 | -65 | -65 | -65 | -65 |
| Tax Rate, % | -2.58 | -2.58 | -2.58 | -2.58 | -2.58 | -2.58 | -2.58 | -2.58 | -2.58 | -2.58 |
| EBITAT | -733.4 | -958.4 | -960.4 | -907.1 | -424.5 | -1,634.4 | -2,884.0 | -5,089.3 | -8,980.7 | -15,847.6 |
| Depreciation | ||||||||||
| Changes in Account Receivables | ||||||||||
| Changes in Inventories | ||||||||||
| Changes in Accounts Payable | ||||||||||
| Capital Expenditure | ||||||||||
| UFCF | -951.4 | -1,426.1 | -1,110.2 | -999.9 | -264.2 | -1,764.3 | -3,324.8 | -5,867.0 | -10,353.1 | -18,269.5 |
| WACC, % | 8.53 | 8.51 | 8.53 | 8.53 | 8.53 | 8.52 | 8.52 | 8.52 | 8.52 | 8.52 |
| PV UFCF | ||||||||||
| SUM PV UFCF | -28,639.5 | |||||||||
| Long Term Growth Rate, % | 2.00 | |||||||||
| Free cash flow (T + 1) | -18,635 | |||||||||
| Terminal Value | -285,631 | |||||||||
| Present Terminal Value | -189,747 | |||||||||
| Enterprise Value | -218,386 | |||||||||
| Net Debt | 445 | |||||||||
| Equity Value | -218,831 | |||||||||
| Diluted Shares Outstanding, MM | 302 | |||||||||
| Equity Value Per Share | -724.46 |
What You Will Receive
- Genuine (6855HK) Financial Data: Pre-loaded with Ascentage Pharma's historical and projected figures for accurate analysis.
- Completely Customizable Template: Easily adjust essential inputs such as revenue growth, WACC, and EBITDA %.
- Instant Calculations: Watch the intrinsic value of Ascentage Pharma update in real-time as you make adjustments.
- Professional Valuation Tool: Tailored for investors, analysts, and consultants aiming for precise DCF outcomes.
- User-Friendly Interface: Intuitive layout and straightforward instructions suitable for all skill levels.
Key Features
- 🔍 Real-Life (6855HK) Financials: Pre-filled historical and projected data for Ascentage Pharma Group International.
- ✏️ Fully Customizable Inputs: Adjust all critical parameters (yellow cells) such as WACC, growth %, and tax rates.
- 📊 Professional DCF Valuation: Built-in formulas calculate Ascentage's intrinsic value using the Discounted Cash Flow method.
- ⚡ Instant Results: Visualize Ascentage's valuation immediately after making adjustments.
- Scenario Analysis: Evaluate and compare outcomes for different financial assumptions side-by-side.
How It Operates
- 1. Access the Template: Download and open the Excel file containing Ascentage Pharma Group International’s (6855HK) preloaded data.
- 2. Modify Assumptions: Adjust key inputs such as growth rates, WACC, and capital expenditures as needed.
- 3. Instantly View Results: The DCF model automatically computes intrinsic value and NPV in real-time.
- 4. Explore Scenarios: Evaluate various forecasts to analyze different valuation possibilities.
- 5. Present with Assurance: Deliver professional valuation insights to bolster your investment decisions.
Why Choose Ascentage Pharma's Calculator?
- Time Efficient: Skip the hassle of building a DCF model from zero – it’s ready for immediate use.
- Enhanced Accuracy: Trustworthy financial data and formulas minimize valuation errors.
- Completely Customizable: Adjust the model to align with your unique assumptions and forecasts.
- User-Friendly: Intuitive charts and outputs simplify the analysis of results.
- Preferred by Professionals: Crafted for experts who prioritize precision and functionality.
Who Can Benefit from This Product?
- Pharmaceutical Students: Master valuation techniques and apply them with real-world data.
- Researchers: Integrate professional models into your academic projects and studies.
- Investors: Validate your assumptions and evaluate valuation scenarios for Ascentage Pharma Group International (6855HK).
- Market Analysts: Enhance your productivity with a pre-built, customizable DCF model.
- Entrepreneurs: Understand the analytical methods used for large public companies like Ascentage Pharma Group International (6855HK).
Contents of the Template
- Pre-Filled Data: Contains Ascentage Pharma's historical financial data and projections.
- Discounted Cash Flow Model: An editable DCF valuation template with automatic calculations.
- Weighted Average Cost of Capital (WACC): A dedicated section for determining WACC based on user-defined inputs.
- Key Financial Ratios: Evaluate Ascentage Pharma's profitability, efficiency, and financial leverage.
- Customizable Inputs: Easily adjust revenue growth rates, profit margins, and tax rates.
- User-Friendly Dashboard: Visual representations and tables summarizing essential valuation outcomes.
Disclaimer
All information, articles, and product details provided on this website are for general informational and educational purposes only. We do not claim any ownership over, nor do we intend to infringe upon, any trademarks, copyrights, logos, brand names, or other intellectual property mentioned or depicted on this site. Such intellectual property remains the property of its respective owners, and any references here are made solely for identification or informational purposes, without implying any affiliation, endorsement, or partnership.
We make no representations or warranties, express or implied, regarding the accuracy, completeness, or suitability of any content or products presented. Nothing on this website should be construed as legal, tax, investment, financial, medical, or other professional advice. In addition, no part of this site—including articles or product references—constitutes a solicitation, recommendation, endorsement, advertisement, or offer to buy or sell any securities, franchises, or other financial instruments, particularly in jurisdictions where such activity would be unlawful.
All content is of a general nature and may not address the specific circumstances of any individual or entity. It is not a substitute for professional advice or services. Any actions you take based on the information provided here are strictly at your own risk. You accept full responsibility for any decisions or outcomes arising from your use of this website and agree to release us from any liability in connection with your use of, or reliance upon, the content or products found herein.