
|
Yangtze óptica de fibra óptica y stock conjunta de cable Compañía limitada (6869.HK) Valoración de DCF |
Completamente Editable: Adáptelo A Sus Necesidades En Excel O Sheets
Diseño Profesional: Plantillas Confiables Y Estándares De La Industria
Predeterminadas Para Un Uso Rápido Y Eficiente
Compatible con MAC / PC, completamente desbloqueado
No Se Necesita Experiencia; Fáciles De Seguir
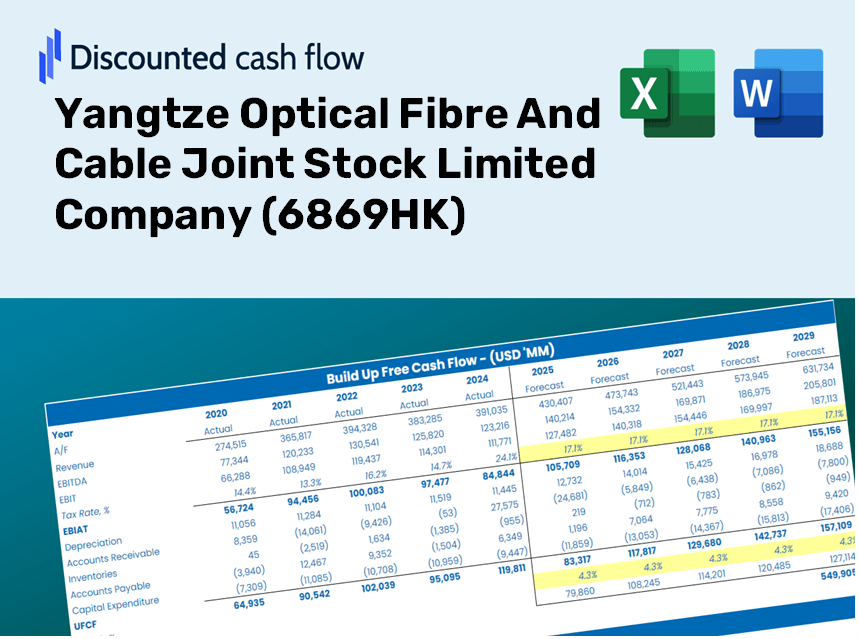
Yangtze Optical Fibre And Cable Joint Stock Limited Company (6869.HK) Bundle
¡Agilice su análisis y mejore la precisión con nuestra calculadora DCF (6869HK)! Equipados con datos auténticos de Yangtze Optical Fiber and Cable Joint Stock Limited Company y suposiciones personalizables, esta herramienta le permite pronosticar, analizar y valor (6869HK) como un inversor experimentado.
Discounted Cash Flow (DCF) - (USD MM)
| Year | AY1 2020 |
AY2 2021 |
AY3 2022 |
AY4 2023 |
AY5 2024 |
FY1 2025 |
FY2 2026 |
FY3 2027 |
FY4 2028 |
FY5 2029 |
|---|---|---|---|---|---|---|---|---|---|---|
| Revenue | 9,007.9 | 10,448.2 | 15,153.2 | 14,629.9 | 13,364.1 | 14,998.4 | 16,832.5 | 18,890.9 | 21,201.0 | 23,793.6 |
| Revenue Growth, % | 0 | 15.99 | 45.03 | -3.45 | -8.65 | 12.23 | 12.23 | 12.23 | 12.23 | 12.23 |
| EBITDA | 1,106.7 | 812.2 | 2,137.2 | 2,516.4 | 2,021.2 | 1,994.4 | 2,238.3 | 2,512.0 | 2,819.2 | 3,164.0 |
| EBITDA, % | 12.29 | 7.77 | 14.1 | 17.2 | 15.12 | 13.3 | 13.3 | 13.3 | 13.3 | 13.3 |
| Depreciation | 417.3 | 417.5 | 664.3 | 932.6 | 873.4 | 777.6 | 872.7 | 979.4 | 1,099.2 | 1,233.6 |
| Depreciation, % | 4.63 | 4 | 4.38 | 6.37 | 6.54 | 5.18 | 5.18 | 5.18 | 5.18 | 5.18 |
| EBIT | 689.4 | 394.7 | 1,472.8 | 1,583.8 | 1,147.8 | 1,216.8 | 1,365.6 | 1,532.6 | 1,720.0 | 1,930.4 |
| EBIT, % | 7.65 | 3.78 | 9.72 | 10.83 | 8.59 | 8.11 | 8.11 | 8.11 | 8.11 | 8.11 |
| Total Cash | 2,559.6 | 4,713.2 | 6,214.4 | 5,416.9 | 5,182.5 | 5,709.6 | 6,407.8 | 7,191.4 | 8,070.8 | 9,057.8 |
| Total Cash, percent | .0 | .0 | .0 | .0 | .0 | .0 | .0 | .0 | .0 | .0 |
| Account Receivables | 4,590.0 | 5,109.5 | 6,429.0 | 6,823.8 | 6,679.5 | 7,166.5 | 8,042.8 | 9,026.4 | 10,130.2 | 11,368.9 |
| Account Receivables, % | 50.96 | 48.9 | 42.43 | 46.64 | 49.98 | 47.78 | 47.78 | 47.78 | 47.78 | 47.78 |
| Inventories | 2,561.1 | 3,027.3 | 3,460.9 | 3,222.7 | 3,479.5 | 3,848.9 | 4,319.5 | 4,847.8 | 5,440.6 | 6,105.9 |
| Inventories, % | 28.43 | 28.97 | 22.84 | 22.03 | 26.04 | 25.66 | 25.66 | 25.66 | 25.66 | 25.66 |
| Accounts Payable | 2,072.2 | 2,442.8 | 2,637.2 | 2,834.3 | 2,786.4 | 3,120.0 | 3,501.5 | 3,929.7 | 4,410.2 | 4,949.6 |
| Accounts Payable, % | 23 | 23.38 | 17.4 | 19.37 | 20.85 | 20.8 | 20.8 | 20.8 | 20.8 | 20.8 |
| Capital Expenditure | -667.4 | -1,176.3 | -2,441.3 | -2,479.1 | -1,518.4 | -1,892.3 | -2,123.7 | -2,383.4 | -2,674.9 | -3,002.0 |
| Capital Expenditure, % | -7.41 | -11.26 | -16.11 | -16.95 | -11.36 | -12.62 | -12.62 | -12.62 | -12.62 | -12.62 |
| Tax Rate, % | -13.99 | -13.99 | -13.99 | -13.99 | -13.99 | -13.99 | -13.99 | -13.99 | -13.99 | -13.99 |
| EBITAT | 647.0 | 373.8 | 1,492.0 | 1,689.3 | 1,308.5 | 1,189.0 | 1,334.4 | 1,497.6 | 1,680.7 | 1,886.3 |
| Depreciation | ||||||||||
| Changes in Account Receivables | ||||||||||
| Changes in Inventories | ||||||||||
| Changes in Accounts Payable | ||||||||||
| Capital Expenditure | ||||||||||
| UFCF | -4,682.0 | -999.9 | -1,843.6 | 183.2 | 503.0 | -448.5 | -882.1 | -990.0 | -1,111.1 | -1,246.9 |
| WACC, % | 4.47 | 4.47 | 4.52 | 4.52 | 4.52 | 4.5 | 4.5 | 4.5 | 4.5 | 4.5 |
| PV UFCF | ||||||||||
| SUM PV UFCF | -4,037.0 | |||||||||
| Long Term Growth Rate, % | 2.00 | |||||||||
| Free cash flow (T + 1) | -1,272 | |||||||||
| Terminal Value | -50,905 | |||||||||
| Present Terminal Value | -40,852 | |||||||||
| Enterprise Value | -44,889 | |||||||||
| Net Debt | 3,998 | |||||||||
| Equity Value | -48,887 | |||||||||
| Diluted Shares Outstanding, MM | 759 | |||||||||
| Equity Value Per Share | -64.37 |
What You'll Receive
- Authentic Yangtze Data: Preloaded financial metrics – including revenue and EBIT – derived from actual and forecasted figures.
- Comprehensive Customization: Modify all essential parameters (yellow cells) such as WACC, growth %, and tax rates.
- Immediate Valuation Adjustments: Automatic recalculations to evaluate the influence of changes on the fair value of Yangtze Optical Fibre And Cable (6869HK).
- Flexible Excel Template: Designed for swift edits, scenario analysis, and detailed projections.
- Efficient and Precise: Avoid starting from scratch while ensuring accuracy and adaptability.
Key Features
- Real-Life (6869HK) Data: Pre-filled with Yangtze Optical Fibre and Cable's historical financials and forward-looking projections.
- Fully Customizable Inputs: Adjust revenue growth rates, profit margins, WACC, tax rates, and capital expenditures.
- Dynamic Valuation Model: Automatic updates to Net Present Value (NPV) and intrinsic value based on your personalized inputs.
- Scenario Testing: Develop multiple forecasting scenarios to evaluate different valuation outcomes.
- User-Friendly Design: Intuitive and structured, catering to both professionals and newcomers.
How It Works
- Step 1: Download the prebuilt Excel template featuring Yangtze Optical Fibre And Cable Joint Stock Limited Company’s (6869HK) data.
- Step 2: Navigate through the pre-filled sheets and familiarize yourself with the essential metrics.
- Step 3: Modify forecasts and assumptions in the editable yellow cells (WACC, growth, margins).
- Step 4: Instantly see the updated results, including the intrinsic value of Yangtze Optical Fibre And Cable (6869HK).
- Step 5: Make well-informed investment choices or create reports based on the generated outputs.
Why Opt for the Yangtze Optical Fibre Calculator?
- Precision: Utilizes authentic financial data from Yangtze Optical Fibre to ensure accuracy.
- Customization: Allows users to easily modify and experiment with different inputs.
- Efficiency: Eliminate the complexities of constructing a DCF model from the ground up.
- Expert-Level Design: Crafted with the precision and usability expected by financial executives.
- Intuitive Interface: Simple to navigate, making it accessible even for those without extensive financial modeling expertise.
Who Can Benefit from This Product?
- Investors: Assess the valuation of Yangtze Optical Fibre And Cable Joint Stock Limited Company (6869HK) prior to making investment decisions.
- Chief Financial Officers and Financial Analysts: Enhance the efficiency of valuation workflows and evaluate financial forecasts.
- Startup Founders: Gain insights into how large public enterprises like Yangtze Optical Fibre And Cable Joint Stock Limited Company (6869HK) are valued.
- Consultants: Create detailed and professional valuation reports for your clients.
- Students and Educators: Utilize real-world data to learn and teach valuation methodologies.
Contents of the Template
- Detailed DCF Model: An editable template featuring comprehensive valuation calculations.
- Real-Time Data: Historical and projected financial figures for Yangtze Optical Fibre and Cable (6869HK) included for in-depth analysis.
- Adjustable Variables: Modify WACC, growth rates, and tax assumptions to explore various scenarios.
- Financial Statements: Complete annual and quarterly breakdowns for enhanced insights.
- Essential Ratios: Integrated analysis of profitability, efficiency, and leverage metrics.
- Visual Dashboard: Charts and tables that present clear, actionable information.
Disclaimer
All information, articles, and product details provided on this website are for general informational and educational purposes only. We do not claim any ownership over, nor do we intend to infringe upon, any trademarks, copyrights, logos, brand names, or other intellectual property mentioned or depicted on this site. Such intellectual property remains the property of its respective owners, and any references here are made solely for identification or informational purposes, without implying any affiliation, endorsement, or partnership.
We make no representations or warranties, express or implied, regarding the accuracy, completeness, or suitability of any content or products presented. Nothing on this website should be construed as legal, tax, investment, financial, medical, or other professional advice. In addition, no part of this site—including articles or product references—constitutes a solicitation, recommendation, endorsement, advertisement, or offer to buy or sell any securities, franchises, or other financial instruments, particularly in jurisdictions where such activity would be unlawful.
All content is of a general nature and may not address the specific circumstances of any individual or entity. It is not a substitute for professional advice or services. Any actions you take based on the information provided here are strictly at your own risk. You accept full responsibility for any decisions or outcomes arising from your use of this website and agree to release us from any liability in connection with your use of, or reliance upon, the content or products found herein.