
|
Raytron Technology Co., Ltd. (688002.ss) Valoración de DCF |
Completamente Editable: Adáptelo A Sus Necesidades En Excel O Sheets
Diseño Profesional: Plantillas Confiables Y Estándares De La Industria
Predeterminadas Para Un Uso Rápido Y Eficiente
Compatible con MAC / PC, completamente desbloqueado
No Se Necesita Experiencia; Fáciles De Seguir
Raytron Technology Co.,Ltd. (688002.SS) Bundle
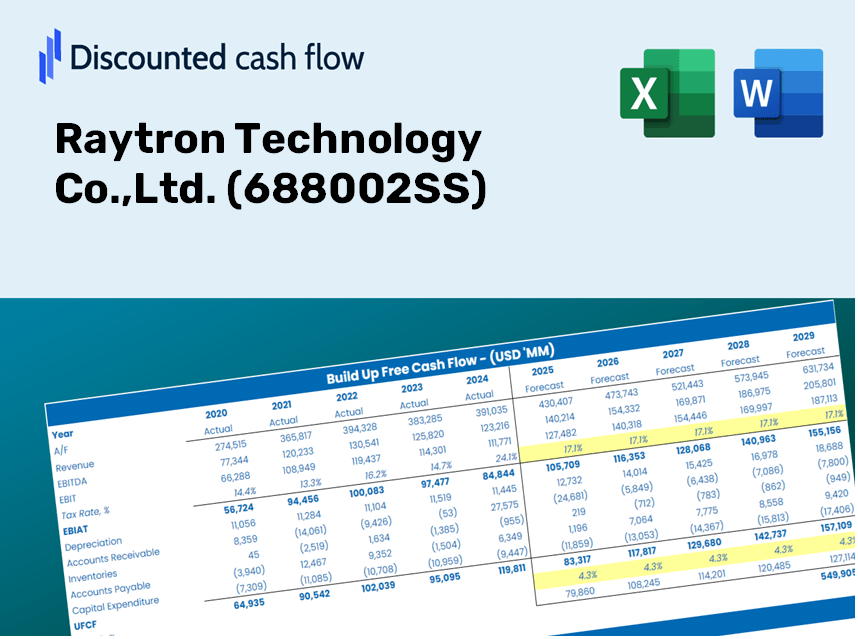
Ya sea que sea un inversor o analista, esta calculadora DCF (688002SS) es su herramienta final para una valoración precisa. Prelabastado con los datos reales de Raytron Technology Co., Ltd., puede ajustar los pronósticos y observar los efectos en tiempo real.
Discounted Cash Flow (DCF) - (USD MM)
| Year | AY1 2020 |
AY2 2021 |
AY3 2022 |
AY4 2023 |
AY5 2024 |
FY1 2025 |
FY2 2026 |
FY3 2027 |
FY4 2028 |
FY5 2029 |
|---|---|---|---|---|---|---|---|---|---|---|
| Revenue | 1,561.4 | 1,780.3 | 2,645.9 | 3,558.6 | 4,315.7 | 5,593.2 | 7,248.9 | 9,394.7 | 12,175.8 | 15,780.0 |
| Revenue Growth, % | 0 | 14.02 | 48.62 | 34.5 | 21.28 | 29.6 | 29.6 | 29.6 | 29.6 | 29.6 |
| EBITDA | 625.4 | 456.1 | 333.6 | 569.0 | 691.6 | 1,233.8 | 1,599.0 | 2,072.4 | 2,685.8 | 3,480.9 |
| EBITDA, % | 40.05 | 25.62 | 12.61 | 15.99 | 16.02 | 22.06 | 22.06 | 22.06 | 22.06 | 22.06 |
| Depreciation | 40.3 | 68.5 | 132.0 | 210.2 | 283.9 | 267.4 | 346.6 | 449.2 | 582.2 | 754.5 |
| Depreciation, % | 2.58 | 3.85 | 4.99 | 5.91 | 6.58 | 4.78 | 4.78 | 4.78 | 4.78 | 4.78 |
| EBIT | 585.0 | 387.6 | 201.6 | 358.8 | 407.6 | 966.4 | 1,252.4 | 1,623.2 | 2,103.7 | 2,726.4 |
| EBIT, % | 37.47 | 21.77 | 7.62 | 10.08 | 9.45 | 17.28 | 17.28 | 17.28 | 17.28 | 17.28 |
| Total Cash | 1,279.5 | 814.4 | 952.6 | 1,390.8 | 1,051.3 | 2,540.8 | 3,292.9 | 4,267.7 | 5,531.0 | 7,168.3 |
| Total Cash, percent | .0 | .0 | .0 | .0 | .0 | .0 | .0 | .0 | .0 | .0 |
| Account Receivables | 508.6 | 773.4 | 1,000.6 | 1,430.0 | 1,519.4 | 2,116.7 | 2,743.3 | 3,555.4 | 4,607.9 | 5,971.9 |
| Account Receivables, % | 32.57 | 43.44 | 37.82 | 40.19 | 35.21 | 37.84 | 37.84 | 37.84 | 37.84 | 37.84 |
| Inventories | 713.2 | 1,202.2 | 1,496.1 | 1,555.8 | 1,744.8 | 2,840.2 | 3,681.0 | 4,770.7 | 6,182.9 | 8,013.1 |
| Inventories, % | 45.68 | 67.53 | 56.55 | 43.72 | 40.43 | 50.78 | 50.78 | 50.78 | 50.78 | 50.78 |
| Accounts Payable | 271.2 | 617.3 | 509.5 | 745.6 | 1,070.7 | 1,309.5 | 1,697.1 | 2,199.5 | 2,850.6 | 3,694.4 |
| Accounts Payable, % | 17.37 | 34.68 | 19.26 | 20.95 | 24.81 | 23.41 | 23.41 | 23.41 | 23.41 | 23.41 |
| Capital Expenditure | -487.2 | -642.9 | -805.1 | -464.8 | -443.4 | -1,354.4 | -1,755.3 | -2,274.9 | -2,948.3 | -3,821.1 |
| Capital Expenditure, % | -31.2 | -36.11 | -30.43 | -13.06 | -10.27 | -24.21 | -24.21 | -24.21 | -24.21 | -24.21 |
| Tax Rate, % | -32.93 | -32.93 | -32.93 | -32.93 | -32.93 | -32.93 | -32.93 | -32.93 | -32.93 | -32.93 |
| EBITAT | 511.9 | 398.8 | 207.5 | 445.6 | 541.9 | 942.2 | 1,221.1 | 1,582.6 | 2,051.1 | 2,658.3 |
| Depreciation | ||||||||||
| Changes in Account Receivables | ||||||||||
| Changes in Inventories | ||||||||||
| Changes in Accounts Payable | ||||||||||
| Capital Expenditure | ||||||||||
| UFCF | -885.5 | -583.2 | -1,094.5 | -62.0 | 429.2 | -1,598.7 | -1,267.3 | -1,642.4 | -2,128.6 | -2,758.8 |
| WACC, % | 7.3 | 7.32 | 7.32 | 7.32 | 7.32 | 7.32 | 7.32 | 7.32 | 7.32 | 7.32 |
| PV UFCF | ||||||||||
| SUM PV UFCF | -7,461.7 | |||||||||
| Long Term Growth Rate, % | 2.00 | |||||||||
| Free cash flow (T + 1) | -2,814 | |||||||||
| Terminal Value | -52,915 | |||||||||
| Present Terminal Value | -37,172 | |||||||||
| Enterprise Value | -44,634 | |||||||||
| Net Debt | 433 | |||||||||
| Equity Value | -45,067 | |||||||||
| Diluted Shares Outstanding, MM | 452 | |||||||||
| Equity Value Per Share | -99.80 |
Benefits You'll Receive
- Comprehensive Financial Model: Utilize Raytron Technology's actual data for accurate DCF valuation.
- Complete Forecasting Control: Modify revenue growth, profit margins, WACC, and other essential variables.
- Real-Time Calculations: Automatic updates let you see results instantly as you make adjustments.
- Investor-Ready Template: A polished Excel spreadsheet tailored for high-quality valuation.
- Customizable and Reusable: Designed for flexibility, allowing for repeated use in detailed forecasting.
Key Features
- Advanced DCF Calculator: Offers comprehensive unlevered and levered DCF valuation models tailored for Raytron Technology Co., Ltd. (688002SS).
- WACC Calculator: Pre-configured Weighted Average Cost of Capital sheet with adjustable inputs specific to the industry.
- Customizable Forecast Assumptions: Easily modify growth projections, capital expenditures, and discount rates for accurate forecasting.
- Integrated Financial Ratios: Evaluate profitability, leverage, and efficiency ratios for Raytron Technology Co., Ltd. (688002SS).
- Interactive Dashboard and Charts: Visual outputs provide a clear summary of key valuation metrics for streamlined analysis.
How It Functions
- Step 1: Download the Excel file.
- Step 2: Examine the pre-filled data for Raytron Technology Co.,Ltd. (688002SS) including historical and forecasted figures.
- Step 3: Modify key assumptions (highlighted in yellow) according to your analysis.
- Step 4: Observe automatic updates to the intrinsic value calculations for Raytron Technology Co.,Ltd. (688002SS).
- Step 5: Utilize the results for making investment decisions or for reporting purposes.
Why Opt for Raytron Technology's Calculator?
- Designed for Industry Experts: A sophisticated tool utilized by analysts, CFOs, and advisors.
- Accurate Financial Data: Including Raytron's historical and projected financials for enhanced reliability.
- Flexible Scenario Analysis: Effortlessly test various forecasts and assumptions.
- Comprehensive Outputs: Instantly computes intrinsic value, NPV, and essential metrics.
- User-Friendly Interface: Detailed instructions provide clear guidance throughout your calculations.
Who Can Benefit from Our Product?
- Institutional Investors: Develop in-depth and accurate valuation models for effective portfolio management.
- Corporate Finance Departments: Evaluate valuation scenarios to inform strategic decision-making within the organization.
- Consultants and Financial Advisors: Equip clients with precise valuation analyses for Raytron Technology Co., Ltd. (688002SS) stock.
- Students and Instructors: Utilize real-world data to enhance learning and practice in financial modeling.
- Tech Analysts: Gain insights into how technology firms like Raytron Technology Co., Ltd. (688002SS) are appraised in the marketplace.
Overview of Template Features
- Pre-Filled DCF Model: Financial data for Raytron Technology Co., Ltd. preloaded for immediate analysis.
- WACC Calculator: Comprehensive calculations for Weighted Average Cost of Capital.
- Financial Ratios: Assess Raytron's profitability, leverage, and operational efficiency.
- Editable Inputs: Modify assumptions such as growth rates, margins, and CAPEX to align with your scenarios.
- Financial Statements: Access annual and quarterly reports for in-depth analysis.
- Interactive Dashboard: Intuitive visualization of key valuation metrics and outcomes.
Disclaimer
All information, articles, and product details provided on this website are for general informational and educational purposes only. We do not claim any ownership over, nor do we intend to infringe upon, any trademarks, copyrights, logos, brand names, or other intellectual property mentioned or depicted on this site. Such intellectual property remains the property of its respective owners, and any references here are made solely for identification or informational purposes, without implying any affiliation, endorsement, or partnership.
We make no representations or warranties, express or implied, regarding the accuracy, completeness, or suitability of any content or products presented. Nothing on this website should be construed as legal, tax, investment, financial, medical, or other professional advice. In addition, no part of this site—including articles or product references—constitutes a solicitation, recommendation, endorsement, advertisement, or offer to buy or sell any securities, franchises, or other financial instruments, particularly in jurisdictions where such activity would be unlawful.
All content is of a general nature and may not address the specific circumstances of any individual or entity. It is not a substitute for professional advice or services. Any actions you take based on the information provided here are strictly at your own risk. You accept full responsibility for any decisions or outcomes arising from your use of this website and agree to release us from any liability in connection with your use of, or reliance upon, the content or products found herein.