
|
Appotronics Corporation Limited (688007.SS) Valoración de DCF |
Completamente Editable: Adáptelo A Sus Necesidades En Excel O Sheets
Diseño Profesional: Plantillas Confiables Y Estándares De La Industria
Predeterminadas Para Un Uso Rápido Y Eficiente
Compatible con MAC / PC, completamente desbloqueado
No Se Necesita Experiencia; Fáciles De Seguir
Appotronics Corporation Limited (688007.SS) Bundle
¿Busca evaluar el valor intrínseco de Appotronics Corporation Limited? Nuestra calculadora DCF (688007SS) integra datos del mundo real con características de personalización completas, lo que le permite ajustar los pronósticos y mejorar sus estrategias de inversión.
What You Will Receive
- Customizable Forecast Parameters: Effortlessly adjust key assumptions (growth %, profit margins, WACC) to explore various scenarios.
- Real-World Insights: Appotronics Corporation Limited’s (688007SS) financial data is pre-loaded to facilitate your analysis.
- Automated DCF Calculations: The template computes Net Present Value (NPV) and intrinsic value automatically.
- Elegant and Flexible Design: A refined Excel model that can be tailored to fit your valuation requirements.
- Designed for Analysts and Investors: Perfect for testing forecasts, assessing strategies, and enhancing efficiency.
Highlighted Features
- Comprehensive Appotronics Financials: Gain access to reliable pre-loaded historical data and projected future performance.
- Adjustable Forecast Parameters: Modify yellow-highlighted fields, including WACC, growth rates, and profit margins.
- Real-Time Calculations: Automatic updates for DCF, Net Present Value (NPV), and cash flow assessments.
- User-Friendly Dashboard: Clear charts and summaries designed for easy interpretation of your valuation outcomes.
- Suitable for All Levels: An intuitive and straightforward setup tailored for investors, CFOs, and consultants alike.
How It Functions
- Download: Get the pre-built Excel file featuring Appotronics Corporation Limited's financial data.
- Customize: Modify projections, including revenue growth, EBITDA percentage, and WACC.
- Automatic Updates: The intrinsic value and NPV calculations refresh in real-time.
- Scenario Testing: Develop multiple forecasts and quickly compare results.
- Informed Decisions: Utilize the valuation findings to shape your investment approach.
Why Opt for This Calculator?
- Reliable Data: Utilize actual financial metrics from Appotronics Corporation Limited (688007SS) for trustworthy valuation outcomes.
- Flexible Options: Tailor essential factors such as growth rates, WACC, and tax rates to align with your forecasts.
- Efficient: Built-in calculations save time by eliminating the need for a blank slate.
- High-Quality Tool: Crafted for the needs of investors, analysts, and consultants.
- Easy to Use: Clear design and straightforward instructions make it accessible for every user.
Who Can Benefit from This Product?
- Individual Investors: Make well-informed choices regarding the purchase or sale of Appotronics Corporation Limited (688007SS) stock.
- Financial Analysts: Enhance valuation processes with comprehensive financial models at your fingertips.
- Consultants: Provide clients with expert valuation insights efficiently and accurately.
- Business Owners: Gain insights into how major companies like Appotronics Corporation Limited (688007SS) are valued to inform your business strategies.
- Finance Students: Acquire practical valuation skills using real-world data and scenarios.
Contents of the Template
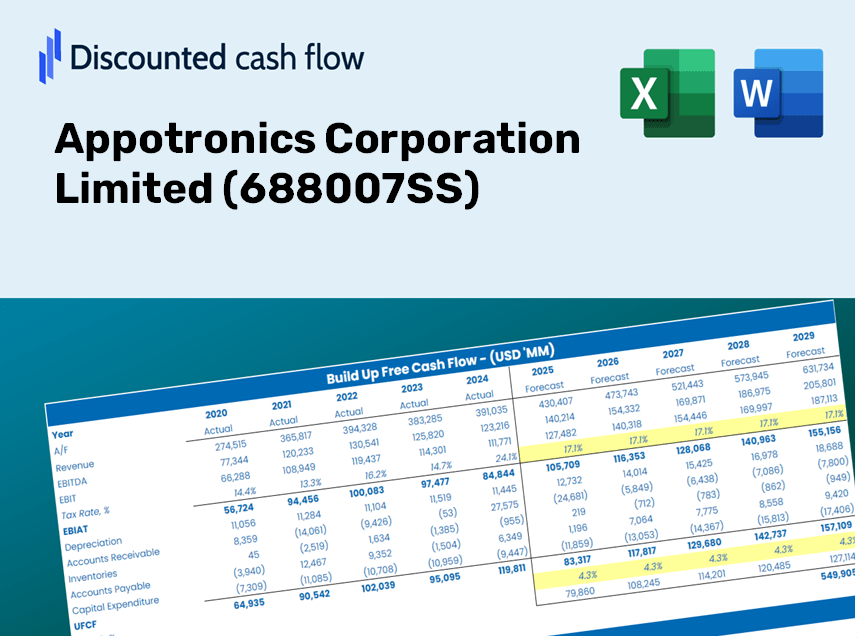
- Preloaded Appotronics Data: Historical and projected financial metrics, including revenue, EBIT, and capital expenditures.
- DCF and WACC Models: High-quality sheets designed for calculating intrinsic value and Weighted Average Cost of Capital.
- Editable Inputs: Yellow-highlighted fields for modifying revenue growth, tax rates, and discount rates.
- Financial Statements: Detailed annual and quarterly financials for in-depth analysis.
- Key Ratios: Profitability, leverage, and efficiency ratios to assess performance.
- Dashboard and Charts: Visual representations of valuation results and underlying assumptions.
Disclaimer
All information, articles, and product details provided on this website are for general informational and educational purposes only. We do not claim any ownership over, nor do we intend to infringe upon, any trademarks, copyrights, logos, brand names, or other intellectual property mentioned or depicted on this site. Such intellectual property remains the property of its respective owners, and any references here are made solely for identification or informational purposes, without implying any affiliation, endorsement, or partnership.
We make no representations or warranties, express or implied, regarding the accuracy, completeness, or suitability of any content or products presented. Nothing on this website should be construed as legal, tax, investment, financial, medical, or other professional advice. In addition, no part of this site—including articles or product references—constitutes a solicitation, recommendation, endorsement, advertisement, or offer to buy or sell any securities, franchises, or other financial instruments, particularly in jurisdictions where such activity would be unlawful.
All content is of a general nature and may not address the specific circumstances of any individual or entity. It is not a substitute for professional advice or services. Any actions you take based on the information provided here are strictly at your own risk. You accept full responsibility for any decisions or outcomes arising from your use of this website and agree to release us from any liability in connection with your use of, or reliance upon, the content or products found herein.