
|
Fujian Forecam Optics Co., Ltd. (688010.SS) Valoración de DCF |
Completamente Editable: Adáptelo A Sus Necesidades En Excel O Sheets
Diseño Profesional: Plantillas Confiables Y Estándares De La Industria
Predeterminadas Para Un Uso Rápido Y Eficiente
Compatible con MAC / PC, completamente desbloqueado
No Se Necesita Experiencia; Fáciles De Seguir
Fujian Forecam Optics Co., Ltd. (688010.SS) Bundle
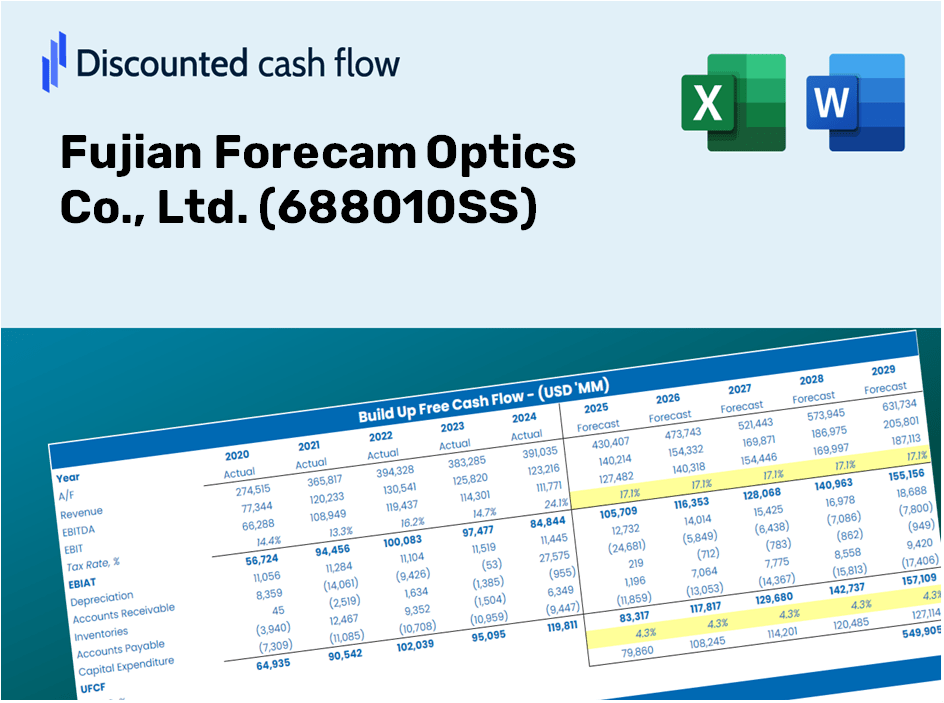
¡Simplifique Fujian Forecam Optics Co., Ltd. (688010SS) Valoración con esta calculadora DCF personalizable! Con Real Fujian Forecam Optics Co., Ltd. (688010SS) financieras y entradas de pronóstico ajustables, puede probar escenarios y descubrir Fujian Forecam Optics Co., Ltd. (688010SS) Valor razonable en minutos.
Discounted Cash Flow (DCF) - (USD MM)
| Year | AY1 2020 |
AY2 2021 |
AY3 2022 |
AY4 2023 |
AY5 2024 |
FY1 2025 |
FY2 2026 |
FY3 2027 |
FY4 2028 |
FY5 2029 |
|---|---|---|---|---|---|---|---|---|---|---|
| Revenue | 587.5 | 674.6 | 781.0 | 587.2 | 621.4 | 639.4 | 657.9 | 677.0 | 696.6 | 716.8 |
| Revenue Growth, % | 0 | 14.82 | 15.76 | -24.81 | 5.82 | 2.9 | 2.9 | 2.9 | 2.9 | 2.9 |
| EBITDA | 103.4 | 153.8 | 136.5 | 31.7 | 128.5 | 107.3 | 110.5 | 113.7 | 116.9 | 120.3 |
| EBITDA, % | 17.59 | 22.8 | 17.48 | 5.39 | 20.67 | 16.79 | 16.79 | 16.79 | 16.79 | 16.79 |
| Depreciation | 43.5 | 78.1 | 106.1 | 103.1 | 108.4 | 86.4 | 88.9 | 91.5 | 94.1 | 96.9 |
| Depreciation, % | 7.41 | 11.57 | 13.58 | 17.56 | 17.44 | 13.51 | 13.51 | 13.51 | 13.51 | 13.51 |
| EBIT | 59.8 | 75.8 | 30.4 | -71.4 | 20.1 | 20.9 | 21.5 | 22.2 | 22.8 | 23.5 |
| EBIT, % | 10.18 | 11.23 | 3.9 | -12.16 | 3.23 | 3.27 | 3.27 | 3.27 | 3.27 | 3.27 |
| Total Cash | 744.7 | 705.8 | 562.1 | 464.6 | 396.7 | 530.6 | 546.0 | 561.8 | 578.1 | 594.9 |
| Total Cash, percent | .0 | .0 | .0 | .0 | .0 | .0 | .0 | .0 | .0 | .0 |
| Account Receivables | 340.5 | 320.6 | 395.1 | 308.6 | 396.0 | 348.3 | 358.4 | 368.8 | 379.5 | 390.5 |
| Account Receivables, % | 57.96 | 47.52 | 50.59 | 52.56 | 63.73 | 54.47 | 54.47 | 54.47 | 54.47 | 54.47 |
| Inventories | 195.7 | 330.1 | 369.6 | 322.9 | 356.2 | 309.3 | 318.3 | 327.5 | 337.0 | 346.7 |
| Inventories, % | 33.3 | 48.92 | 47.32 | 54.99 | 57.32 | 48.37 | 48.37 | 48.37 | 48.37 | 48.37 |
| Accounts Payable | 175.9 | 169.4 | 194.8 | 107.5 | 137.8 | 154.0 | 158.5 | 163.1 | 167.8 | 172.7 |
| Accounts Payable, % | 29.94 | 25.1 | 24.94 | 18.31 | 22.17 | 24.09 | 24.09 | 24.09 | 24.09 | 24.09 |
| Capital Expenditure | -344.5 | -238.0 | -148.8 | -103.2 | -32.7 | -173.7 | -178.7 | -183.9 | -189.2 | -194.7 |
| Capital Expenditure, % | -58.64 | -35.27 | -19.06 | -17.57 | -5.26 | -27.16 | -27.16 | -27.16 | -27.16 | -27.16 |
| Tax Rate, % | -658.53 | -658.53 | -658.53 | -658.53 | -658.53 | -658.53 | -658.53 | -658.53 | -658.53 | -658.53 |
| EBITAT | 55.4 | 67.8 | 51.0 | -54.7 | 152.2 | 19.2 | 19.8 | 20.3 | 20.9 | 21.5 |
| Depreciation | ||||||||||
| Changes in Account Receivables | ||||||||||
| Changes in Inventories | ||||||||||
| Changes in Accounts Payable | ||||||||||
| Capital Expenditure | ||||||||||
| UFCF | -605.9 | -213.1 | -80.3 | -8.9 | 137.5 | 42.8 | -84.6 | -87.1 | -89.6 | -92.2 |
| WACC, % | 4.39 | 4.38 | 4.42 | 4.32 | 4.42 | 4.39 | 4.39 | 4.39 | 4.39 | 4.39 |
| PV UFCF | ||||||||||
| SUM PV UFCF | -263.0 | |||||||||
| Long Term Growth Rate, % | 4.00 | |||||||||
| Free cash flow (T + 1) | -96 | |||||||||
| Terminal Value | -24,851 | |||||||||
| Present Terminal Value | -20,051 | |||||||||
| Enterprise Value | -20,314 | |||||||||
| Net Debt | 296 | |||||||||
| Equity Value | -20,610 | |||||||||
| Diluted Shares Outstanding, MM | 158 | |||||||||
| Equity Value Per Share | -130.25 |
Your Benefits
- Adjustable Forecast Parameters: Effortlessly modify key inputs (growth %, margins, WACC) to explore various scenarios.
- Comprehensive Market Data: Pre-loaded financial information for Fujian Forecam Optics Co., Ltd. (688010SS) to facilitate your analysis.
- Instant DCF Calculations: The template automatically computes Net Present Value (NPV) and intrinsic value on your behalf.
- Versatile and Professional Design: A sophisticated Excel model tailored to meet your valuation requirements.
- Engineered for Analysts and Investors: Perfect for evaluating forecasts, confirming strategies, and enhancing efficiency.
Key Features
- Comprehensive Fujian Forecam Data: Equipped with the company's historical financial information and future growth forecasts.
- Completely Customizable Variables: Modify revenue growth rates, profit margins, discount rates, tax percentages, and capital investments.
- Interactive Valuation Model: Real-time updates to Net Present Value (NPV) and intrinsic value based on your personalized inputs.
- Scenario Analysis: Develop various forecasting scenarios to explore diverse valuation results.
- Intuitive User Interface: Designed with a clear structure, suitable for both seasoned professionals and newcomers.
How It Works
- Step 1: Download the Excel template for Fujian Forecam Optics Co., Ltd. (688010SS).
- Step 2: Review the pre-filled financial data and projections specific to Fujian Forecam.
- Step 3: Adjust key inputs such as revenue growth, WACC, and tax rates (highlighted cells).
- Step 4: Observe the DCF model refresh in real-time as you modify your assumptions.
- Step 5: Evaluate the results and leverage the insights for your investment strategies.
Why Choose Fujian Forecam Optics Co., Ltd. (688010SS)?
- Convenient and Quick: Skip the hassle of manual calculations – our tools are readily available for your use.
- Enhanced Precision: Utilize dependable optical data and methodologies to minimize valuation discrepancies.
- Completely Adaptable: Modify the model to align with your specific assumptions and forecasts.
- Simple to Analyze: User-friendly charts and outputs facilitate easy interpretation of results.
- Endorsed by Industry Leaders: Crafted for professionals who prioritize accuracy and functionality.
Who Can Benefit from This Product?
- Individual Investors: Gain insights to make informed decisions about investing in Fujian Forecam Optics Co., Ltd. (688010SS).
- Financial Analysts: Enhance your analysis with efficient valuation tools tailored for the optics industry.
- Consultants: Provide your clients with precise valuation assessments for effective strategy development.
- Business Owners: Learn about the valuation methodologies of leading firms like Fujian Forecam Optics to refine your own business strategies.
- Finance Students: Acquire practical skills in valuation using real-life examples from Fujian Forecam Optics Co., Ltd. (688010SS).
Contents of the Template
- Operating and Balance Sheet Data: Pre-filled historical data and forecasts for Fujian Forecam Optics Co., Ltd. (688010SS), including metrics such as revenue, EBITDA, EBIT, and capital expenditures.
- WACC Calculation: A dedicated sheet for calculating the Weighted Average Cost of Capital (WACC), featuring key parameters like Beta, risk-free rate, and share price.
- DCF Valuation (Unlevered and Levered): Customizable Discounted Cash Flow models that illustrate the intrinsic value with comprehensive calculations.
- Financial Statements: Pre-loaded financial statements (both annual and quarterly) to facilitate thorough analysis.
- Key Ratios: Provides important profitability, leverage, and efficiency ratios specific to Fujian Forecam Optics Co., Ltd. (688010SS).
- Dashboard and Charts: A visual summary of valuation outputs and assumptions, designed for easy analysis of results.
Disclaimer
All information, articles, and product details provided on this website are for general informational and educational purposes only. We do not claim any ownership over, nor do we intend to infringe upon, any trademarks, copyrights, logos, brand names, or other intellectual property mentioned or depicted on this site. Such intellectual property remains the property of its respective owners, and any references here are made solely for identification or informational purposes, without implying any affiliation, endorsement, or partnership.
We make no representations or warranties, express or implied, regarding the accuracy, completeness, or suitability of any content or products presented. Nothing on this website should be construed as legal, tax, investment, financial, medical, or other professional advice. In addition, no part of this site—including articles or product references—constitutes a solicitation, recommendation, endorsement, advertisement, or offer to buy or sell any securities, franchises, or other financial instruments, particularly in jurisdictions where such activity would be unlawful.
All content is of a general nature and may not address the specific circumstances of any individual or entity. It is not a substitute for professional advice or services. Any actions you take based on the information provided here are strictly at your own risk. You accept full responsibility for any decisions or outcomes arising from your use of this website and agree to release us from any liability in connection with your use of, or reliance upon, the content or products found herein.