
|
Nanjing Vazyme Biotech Co., Ltd. (688105.ss) Valoración de DCF |
Completamente Editable: Adáptelo A Sus Necesidades En Excel O Sheets
Diseño Profesional: Plantillas Confiables Y Estándares De La Industria
Predeterminadas Para Un Uso Rápido Y Eficiente
Compatible con MAC / PC, completamente desbloqueado
No Se Necesita Experiencia; Fáciles De Seguir
Nanjing Vazyme Biotech Co., Ltd. (688105.SS) Bundle
¡Explore el futuro financiero de Nanjing Vazyme Biotech Co., Ltd. (688105SS) con nuestra calculadora DCF fácil de usar! Ingrese sus estimaciones para el crecimiento, los márgenes de beneficio y los gastos para determinar el valor intrínseco de Nanjing Vazyme Biotech Co., Ltd. (688105SS) y mejorar sus decisiones de inversión.
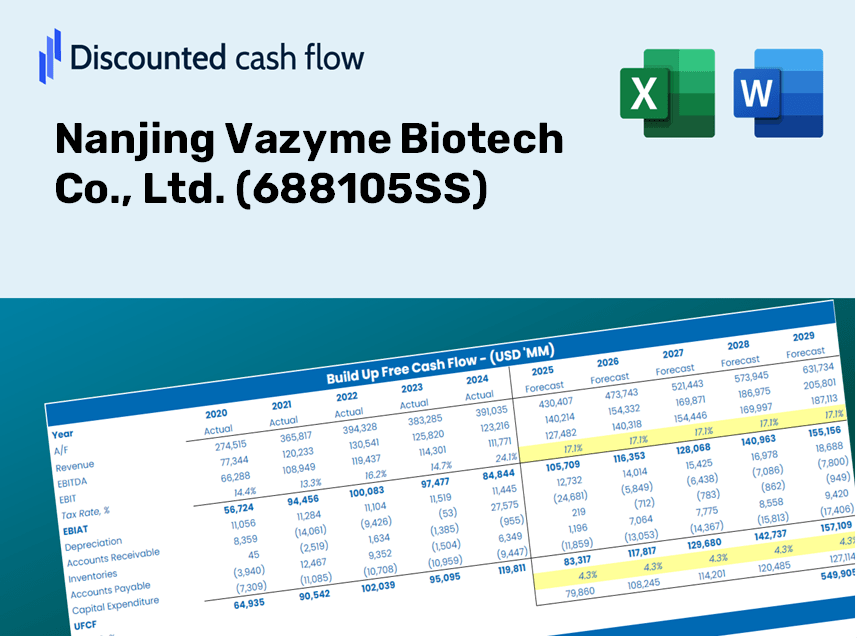
Discounted Cash Flow (DCF) - (USD MM)
| Year | AY1 2020 |
AY2 2021 |
AY3 2022 |
AY4 2023 |
AY5 2024 |
FY1 2025 |
FY2 2026 |
FY3 2027 |
FY4 2028 |
FY5 2029 |
|---|---|---|---|---|---|---|---|---|---|---|
| Revenue | 1,564.5 | 1,868.6 | 3,569.0 | 1,286.0 | 1,377.9 | 1,913.2 | 2,656.5 | 3,688.6 | 5,121.6 | 7,111.4 |
| Revenue Growth, % | 0 | 19.44 | 90.99 | -63.97 | 7.15 | 38.85 | 38.85 | 38.85 | 38.85 | 38.85 |
| EBITDA | 968.7 | 761.2 | 913.6 | -173.9 | -17.4 | 434.2 | 602.9 | 837.1 | 1,162.3 | 1,613.8 |
| EBITDA, % | 61.92 | 40.73 | 25.6 | -13.52 | -1.26 | 22.69 | 22.69 | 22.69 | 22.69 | 22.69 |
| Depreciation | 13.7 | 31.3 | 63.4 | 97.7 | 95.4 | 72.1 | 100.1 | 139.0 | 193.1 | 268.1 |
| Depreciation, % | 0.87744 | 1.67 | 1.78 | 7.59 | 6.93 | 3.77 | 3.77 | 3.77 | 3.77 | 3.77 |
| EBIT | 954.9 | 729.9 | 850.2 | -271.5 | -112.8 | 362.1 | 502.7 | 698.0 | 969.2 | 1,345.8 |
| EBIT, % | 61.04 | 39.06 | 23.82 | -21.11 | -8.19 | 18.92 | 18.92 | 18.92 | 18.92 | 18.92 |
| Total Cash | 1,017.3 | 3,453.6 | 3,263.9 | 3,480.9 | 2,656.2 | 1,746.7 | 2,425.3 | 3,367.5 | 4,675.8 | 6,492.4 |
| Total Cash, percent | .0 | .0 | .0 | .0 | .0 | .0 | .0 | .0 | .0 | .0 |
| Account Receivables | 234.0 | 324.4 | 844.9 | 351.9 | 503.1 | 458.7 | 636.9 | 884.3 | 1,227.9 | 1,704.9 |
| Account Receivables, % | 14.95 | 17.36 | 23.67 | 27.37 | 36.51 | 23.97 | 23.97 | 23.97 | 23.97 | 23.97 |
| Inventories | 132.4 | 242.2 | 364.2 | 346.2 | 362.2 | 324.6 | 450.7 | 625.9 | 869.0 | 1,206.6 |
| Inventories, % | 8.46 | 12.96 | 10.2 | 26.92 | 26.28 | 16.97 | 16.97 | 16.97 | 16.97 | 16.97 |
| Accounts Payable | 58.6 | 118.8 | 318.8 | 146.8 | 90.4 | 141.6 | 196.6 | 273.0 | 379.1 | 526.4 |
| Accounts Payable, % | 3.74 | 6.36 | 8.93 | 11.42 | 6.56 | 7.4 | 7.4 | 7.4 | 7.4 | 7.4 |
| Capital Expenditure | -152.5 | -262.0 | -962.9 | -232.9 | -74.9 | -284.3 | -394.7 | -548.1 | -761.0 | -1,056.7 |
| Capital Expenditure, % | -9.75 | -14.02 | -26.98 | -18.11 | -5.44 | -14.86 | -14.86 | -14.86 | -14.86 | -14.86 |
| Tax Rate, % | 68.94 | 68.94 | 68.94 | 68.94 | 68.94 | 68.94 | 68.94 | 68.94 | 68.94 | 68.94 |
| EBITAT | 818.0 | 647.6 | 829.1 | -166.5 | -35.1 | 263.8 | 366.3 | 508.6 | 706.1 | 980.5 |
| Depreciation | ||||||||||
| Changes in Account Receivables | ||||||||||
| Changes in Inventories | ||||||||||
| Changes in Accounts Payable | ||||||||||
| Capital Expenditure | ||||||||||
| UFCF | 371.5 | 276.9 | -512.9 | 37.2 | -238.0 | 184.8 | -177.6 | -246.6 | -342.5 | -475.5 |
| WACC, % | 7.78 | 7.79 | 7.81 | 7.71 | 7.62 | 7.74 | 7.74 | 7.74 | 7.74 | 7.74 |
| PV UFCF | ||||||||||
| SUM PV UFCF | -760.3 | |||||||||
| Long Term Growth Rate, % | 2.00 | |||||||||
| Free cash flow (T + 1) | -485 | |||||||||
| Terminal Value | -8,447 | |||||||||
| Present Terminal Value | -5,818 | |||||||||
| Enterprise Value | -6,578 | |||||||||
| Net Debt | 260 | |||||||||
| Equity Value | -6,839 | |||||||||
| Diluted Shares Outstanding, MM | 397 | |||||||||
| Equity Value Per Share | -17.23 |
What You Will Receive
- Authentic 688105SS Financial Data: Pre-populated with Nanjing Vazyme Biotech's historical and future projections for accurate analysis.
- Completely Customizable Template: Adjust critical inputs such as revenue growth, WACC, and EBITDA percentage effortlessly.
- Instant Calculations: Watch the intrinsic value of Nanjing Vazyme Biotech update automatically based on your modifications.
- Expert Valuation Tool: Tailored for investors, analysts, and consultants aiming for precise DCF results.
- Intuitive Design: Streamlined layout and clear guidance suitable for users of all expertise levels.
Key Features
- 🔍 Real-Life NVZY Financials: Pre-filled historical and projected data for Nanjing Vazyme Biotech Co., Ltd. (688105SS).
- ✏️ Fully Customizable Inputs: Adjust all critical parameters (yellow cells) such as WACC, growth %, and tax rates.
- 📊 Professional DCF Valuation: Built-in formulas compute Nanjing Vazyme’s intrinsic value using the Discounted Cash Flow method.
- ⚡ Instant Results: Visualize Nanjing Vazyme's valuation immediately after making adjustments.
- Scenario Analysis: Test and compare outcomes for various financial assumptions side-by-side.
How It Works
- Step 1: Download the Excel file.
- Step 2: Review Nanjing Vazyme Biotech Co., Ltd.'s pre-filled financial data and forecasts.
- Step 3: Adjust key inputs such as revenue growth, WACC, and tax rates (highlighted cells).
- Step 4: Observe the DCF model update in real-time as you modify your assumptions.
- Step 5: Assess the outputs and leverage the results for your investment strategies.
Why Opt for Nanjing Vazyme Biotech Co., Ltd. (688105SS)?
- Efficient Solutions: Utilize our advanced tools without the hassle of starting from scratch.
- Enhanced Precision: Our reliable data and methodologies minimize errors in your assessments.
- Fully Adaptable: Customize our offerings to align with your specific goals and forecasts.
- User-Friendly Insights: Intuitive graphs and outputs allow for straightforward analysis of results.
- Recognized by Professionals: Tailored for industry experts who prioritize accuracy and effectiveness.
Who Can Benefit from This Product?
- Investors: Make informed investment choices with a high-quality valuation tool.
- Financial Analysts: Streamline your workflow with a customizable DCF model at your fingertips.
- Consultants: Effortlessly modify the template for client presentations or reports.
- Finance Enthusiasts: Enhance your knowledge of valuation methods through practical examples.
- Educators and Students: Utilize this resource as a hands-on learning aid in finance courses.
Note: For all references to the company, please include its symbol Nanjing Vazyme Biotech Co., Ltd. (688105SS).
What the Template Contains
- Historical Data: Includes Nanjing Vazyme Biotech Co., Ltd.'s past financials and baseline forecasts.
- DCF and Levered DCF Models: Detailed templates to calculate Nanjing Vazyme's intrinsic value.
- WACC Sheet: Pre-built calculations for Weighted Average Cost of Capital.
- Editable Inputs: Modify key drivers like growth rates, EBITDA %, and CAPEX assumptions.
- Quarterly and Annual Statements: A complete breakdown of Nanjing Vazyme's financials.
- Interactive Dashboard: Visualize valuation results and projections dynamically.
Disclaimer
All information, articles, and product details provided on this website are for general informational and educational purposes only. We do not claim any ownership over, nor do we intend to infringe upon, any trademarks, copyrights, logos, brand names, or other intellectual property mentioned or depicted on this site. Such intellectual property remains the property of its respective owners, and any references here are made solely for identification or informational purposes, without implying any affiliation, endorsement, or partnership.
We make no representations or warranties, express or implied, regarding the accuracy, completeness, or suitability of any content or products presented. Nothing on this website should be construed as legal, tax, investment, financial, medical, or other professional advice. In addition, no part of this site—including articles or product references—constitutes a solicitation, recommendation, endorsement, advertisement, or offer to buy or sell any securities, franchises, or other financial instruments, particularly in jurisdictions where such activity would be unlawful.
All content is of a general nature and may not address the specific circumstances of any individual or entity. It is not a substitute for professional advice or services. Any actions you take based on the information provided here are strictly at your own risk. You accept full responsibility for any decisions or outcomes arising from your use of this website and agree to release us from any liability in connection with your use of, or reliance upon, the content or products found herein.