
|
Suzhou Jinhong Gas Co., Ltd. (688106.ss) Valoración de DCF |
Completamente Editable: Adáptelo A Sus Necesidades En Excel O Sheets
Diseño Profesional: Plantillas Confiables Y Estándares De La Industria
Predeterminadas Para Un Uso Rápido Y Eficiente
Compatible con MAC / PC, completamente desbloqueado
No Se Necesita Experiencia; Fáciles De Seguir
Suzhou Jinhong Gas Co.,Ltd. (688106.SS) Bundle
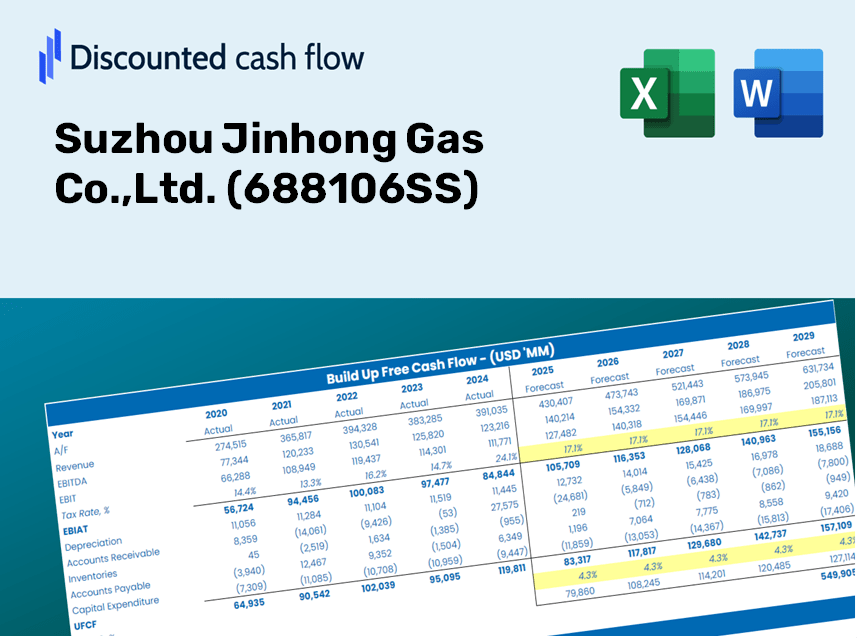
¡Obtenga información sobre su análisis de valoración Suzhou Jinhong Gas Co., Ltd. (688106SS) utilizando nuestra sofisticada calculadora DCF! Antes de datos reales (688106SS), esta plantilla de Excel le permite ajustar los pronósticos y supuestos para calcular con precisión el valor intrínseco de Suzhou Jinhong Gas Co., Ltd.
Discounted Cash Flow (DCF) - (USD MM)
| Year | AY1 2020 |
AY2 2021 |
AY3 2022 |
AY4 2023 |
AY5 2024 |
FY1 2025 |
FY2 2026 |
FY3 2027 |
FY4 2028 |
FY5 2029 |
|---|---|---|---|---|---|---|---|---|---|---|
| Revenue | 1,243.3 | 1,741.3 | 1,967.1 | 2,427.4 | 2,525.3 | 3,033.2 | 3,643.2 | 4,375.9 | 5,256.0 | 6,313.2 |
| Revenue Growth, % | 0 | 40.05 | 12.97 | 23.4 | 4.03 | 20.11 | 20.11 | 20.11 | 20.11 | 20.11 |
| EBITDA | 344.9 | 326.8 | 466.0 | 630.7 | 575.2 | 721.7 | 866.8 | 1,041.1 | 1,250.5 | 1,502.0 |
| EBITDA, % | 27.74 | 18.77 | 23.69 | 25.98 | 22.78 | 23.79 | 23.79 | 23.79 | 23.79 | 23.79 |
| Depreciation | 136.2 | 175.5 | 215.7 | 237.9 | 284.2 | 321.8 | 386.6 | 464.3 | 557.7 | 669.9 |
| Depreciation, % | 10.95 | 10.08 | 10.96 | 9.8 | 11.26 | 10.61 | 10.61 | 10.61 | 10.61 | 10.61 |
| EBIT | 208.7 | 151.3 | 250.3 | 392.8 | 291.0 | 399.8 | 480.2 | 576.8 | 692.8 | 832.2 |
| EBIT, % | 16.79 | 8.69 | 12.73 | 16.18 | 11.52 | 13.18 | 13.18 | 13.18 | 13.18 | 13.18 |
| Total Cash | 1,831.7 | 1,315.3 | 1,221.2 | 1,451.8 | 1,197.9 | 2,092.1 | 2,512.9 | 3,018.2 | 3,625.3 | 4,354.4 |
| Total Cash, percent | .0 | .0 | .0 | .0 | .0 | .0 | .0 | .0 | .0 | .0 |
| Account Receivables | 379.9 | 553.7 | 614.6 | 703.7 | 677.4 | 906.4 | 1,088.7 | 1,307.6 | 1,570.6 | 1,886.5 |
| Account Receivables, % | 30.55 | 31.8 | 31.24 | 28.99 | 26.83 | 29.88 | 29.88 | 29.88 | 29.88 | 29.88 |
| Inventories | 53.1 | 108.7 | 98.3 | 145.3 | 154.5 | 167.6 | 201.3 | 241.7 | 290.3 | 348.7 |
| Inventories, % | 4.27 | 6.24 | 5 | 5.99 | 6.12 | 5.52 | 5.52 | 5.52 | 5.52 | 5.52 |
| Accounts Payable | 267.3 | 477.9 | 308.3 | 756.2 | 717.5 | 753.3 | 904.8 | 1,086.8 | 1,305.4 | 1,568.0 |
| Accounts Payable, % | 21.5 | 27.44 | 15.67 | 31.15 | 28.41 | 24.84 | 24.84 | 24.84 | 24.84 | 24.84 |
| Capital Expenditure | -281.1 | -511.7 | -749.5 | -1,072.0 | -1,070.0 | -1,071.5 | -1,287.0 | -1,545.8 | -1,856.7 | -2,230.1 |
| Capital Expenditure, % | -22.6 | -29.39 | -38.1 | -44.16 | -42.37 | -35.33 | -35.33 | -35.33 | -35.33 | -35.33 |
| Tax Rate, % | 24.4 | 24.4 | 24.4 | 24.4 | 24.4 | 24.4 | 24.4 | 24.4 | 24.4 | 24.4 |
| EBITAT | 171.9 | 126.4 | 204.9 | 308.7 | 220.0 | 321.4 | 386.0 | 463.7 | 556.9 | 668.9 |
| Depreciation | ||||||||||
| Changes in Account Receivables | ||||||||||
| Changes in Inventories | ||||||||||
| Changes in Accounts Payable | ||||||||||
| Capital Expenditure | ||||||||||
| UFCF | -138.6 | -228.7 | -548.9 | -213.6 | -587.4 | -634.4 | -578.9 | -695.3 | -835.1 | -1,003.1 |
| WACC, % | 4.53 | 4.54 | 4.53 | 4.51 | 4.49 | 4.52 | 4.52 | 4.52 | 4.52 | 4.52 |
| PV UFCF | ||||||||||
| SUM PV UFCF | -3,249.6 | |||||||||
| Long Term Growth Rate, % | 3.50 | |||||||||
| Free cash flow (T + 1) | -1,038 | |||||||||
| Terminal Value | -101,748 | |||||||||
| Present Terminal Value | -81,568 | |||||||||
| Enterprise Value | -84,818 | |||||||||
| Net Debt | 1,384 | |||||||||
| Equity Value | -86,202 | |||||||||
| Diluted Shares Outstanding, MM | 530 | |||||||||
| Equity Value Per Share | -162.79 |
Benefits You Will Receive
- Authentic 688106SS Financials: Access to comprehensive historical data and future forecasts for precise valuation.
- Customizable Parameters: Adjust WACC, tax rates, revenue growth, and capital expenditure inputs as needed.
- Instantaneous Calculations: Automatic computation of intrinsic value and NPV in real-time.
- Comprehensive Scenario Analysis: Evaluate different scenarios to project the future performance of Suzhou Jinhong Gas Co., Ltd.
- User-Friendly Interface: Designed for industry professionals while remaining approachable for newcomers.
Key Features
- Comprehensive Data: Suzhou Jinhong Gas Co., Ltd.'s financial records and projected forecasts already included.
- Customizable Parameters: Modify WACC, tax rates, revenue growth, and EBITDA margins as needed.
- Real-Time Insights: Instantly view the recalculated intrinsic value of Suzhou Jinhong Gas Co., Ltd. (688106SS).
- Informative Visuals: Dashboard graphs showcase valuation outcomes and essential metrics.
- Designed for Precision: A reliable resource for analysts, investors, and finance professionals.
How It Works
- Download the Template: Gain immediate access to the Excel-based Suzhou Jinhong Gas Co.,Ltd. (688106SS) DCF Calculator.
- Input Your Assumptions: Modify the yellow-highlighted cells for growth rates, WACC, margins, and other variables.
- Instant Calculations: The model automatically recalculates the intrinsic value for Suzhou Jinhong Gas Co.,Ltd. (688106SS).
- Test Scenarios: Experiment with different assumptions to assess potential valuation changes.
- Analyze and Decide: Utilize the results to inform your investment or financial analysis decisions.
Why Choose Suzhou Jinhong Gas Co., Ltd. (688106SS)?
- User-Friendly: Tailored for both novices and seasoned professionals.
- Customizable Inputs: Effortlessly adjust parameters to suit your analysis needs.
- Real-Time Insights: Monitor immediate fluctuations in valuation as you modify inputs.
- Preloaded Data: Comes equipped with Suzhou Jinhong's actual financial metrics for swift evaluation.
- Industry Trusted: Employed by investors and analysts to enhance decision-making processes.
Who Should Utilize Suzhou Jinhong Gas Co.,Ltd. (688106SS)?
- Energy Sector Students: Understand market dynamics and apply analytical techniques to real-world scenarios.
- Researchers: Integrate industry-specific models into academic projects or studies.
- Investors: Validate your investment hypotheses and assess valuation metrics for Suzhou Jinhong Gas Co.,Ltd. (688106SS).
- Market Analysts: Enhance your analysis with a customizable financial model tailored for the energy sector.
- Entrepreneurs: Discover how established companies like Suzhou Jinhong Gas Co.,Ltd. (688106SS) are evaluated in the market.
What the Template Contains
- Pre-Filled Data: Includes Suzhou Jinhong Gas Co., Ltd.'s historical financials and forecasts.
- Discounted Cash Flow Model: Editable DCF valuation model with automatic calculations.
- Weighted Average Cost of Capital (WACC): A dedicated sheet for calculating WACC based on tailored inputs.
- Key Financial Ratios: Assess Suzhou Jinhong Gas Co., Ltd.'s profitability, efficiency, and leverage.
- Customizable Inputs: Easily modify revenue growth, margins, and tax rates.
- Clear Dashboard: Charts and tables providing a summary of key valuation results.
Disclaimer
All information, articles, and product details provided on this website are for general informational and educational purposes only. We do not claim any ownership over, nor do we intend to infringe upon, any trademarks, copyrights, logos, brand names, or other intellectual property mentioned or depicted on this site. Such intellectual property remains the property of its respective owners, and any references here are made solely for identification or informational purposes, without implying any affiliation, endorsement, or partnership.
We make no representations or warranties, express or implied, regarding the accuracy, completeness, or suitability of any content or products presented. Nothing on this website should be construed as legal, tax, investment, financial, medical, or other professional advice. In addition, no part of this site—including articles or product references—constitutes a solicitation, recommendation, endorsement, advertisement, or offer to buy or sell any securities, franchises, or other financial instruments, particularly in jurisdictions where such activity would be unlawful.
All content is of a general nature and may not address the specific circumstances of any individual or entity. It is not a substitute for professional advice or services. Any actions you take based on the information provided here are strictly at your own risk. You accept full responsibility for any decisions or outcomes arising from your use of this website and agree to release us from any liability in connection with your use of, or reliance upon, the content or products found herein.