
|
Changchun BCHT Biotechnology Co. (688276.ss) Valoración de DCF |
Completamente Editable: Adáptelo A Sus Necesidades En Excel O Sheets
Diseño Profesional: Plantillas Confiables Y Estándares De La Industria
Predeterminadas Para Un Uso Rápido Y Eficiente
Compatible con MAC / PC, completamente desbloqueado
No Se Necesita Experiencia; Fáciles De Seguir
Changchun BCHT Biotechnology Co. (688276.SS) Bundle
¡Mejore su estrategia de inversión con la calculadora DCF (688276SS)! Utilice datos financieros auténticos de Changchun BCHT Biotechnology Co., ajuste las proyecciones y gastos de crecimiento, y observe instantáneamente cómo estas modificaciones afectan el valor intrínseco de (688276SS).
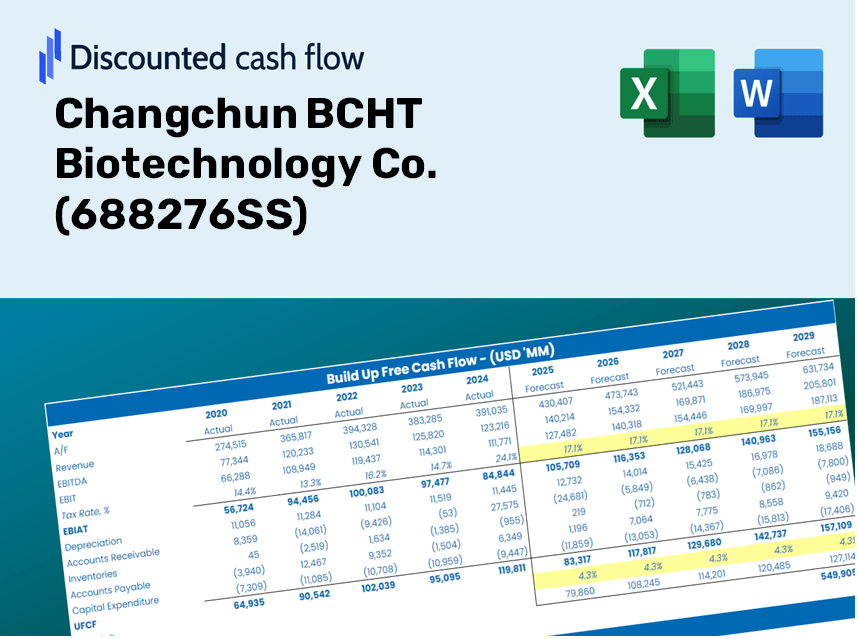
Discounted Cash Flow (DCF) - (USD MM)
| Year | AY1 2020 |
AY2 2021 |
AY3 2022 |
AY4 2023 |
AY5 2024 |
FY1 2025 |
FY2 2026 |
FY3 2027 |
FY4 2028 |
FY5 2029 |
|---|---|---|---|---|---|---|---|---|---|---|
| Revenue | 1,441.4 | 1,202.0 | 1,071.4 | 1,811.6 | 1,229.1 | 1,258.2 | 1,287.9 | 1,318.4 | 1,349.5 | 1,381.5 |
| Revenue Growth, % | 0 | -16.6 | -10.86 | 69.08 | -32.16 | 2.36 | 2.36 | 2.36 | 2.36 | 2.36 |
| EBITDA | 546.1 | 332.4 | 274.2 | 662.9 | 361.5 | 395.4 | 404.7 | 414.3 | 424.1 | 434.1 |
| EBITDA, % | 37.89 | 27.65 | 25.59 | 36.59 | 29.41 | 31.43 | 31.43 | 31.43 | 31.43 | 31.43 |
| Depreciation | 59.5 | 69.3 | 76.6 | 99.0 | 104.2 | 78.0 | 79.8 | 81.7 | 83.6 | 85.6 |
| Depreciation, % | 4.13 | 5.77 | 7.15 | 5.46 | 8.48 | 6.2 | 6.2 | 6.2 | 6.2 | 6.2 |
| EBIT | 486.6 | 263.1 | 197.5 | 563.9 | 257.3 | 317.4 | 324.9 | 332.6 | 340.5 | 348.5 |
| EBIT, % | 33.76 | 21.89 | 18.44 | 31.13 | 20.93 | 25.23 | 25.23 | 25.23 | 25.23 | 25.23 |
| Total Cash | 309.6 | 1,155.6 | 866.5 | 442.2 | 344.9 | 631.5 | 646.4 | 661.7 | 677.4 | 693.4 |
| Total Cash, percent | .0 | .0 | .0 | .0 | .0 | .0 | .0 | .0 | .0 | .0 |
| Account Receivables | 733.2 | 763.9 | 971.3 | 30.0 | 1,408.8 | 771.8 | 790.1 | 808.8 | 827.9 | 847.5 |
| Account Receivables, % | 50.87 | 63.55 | 90.65 | 1.66 | 114.62 | 61.35 | 61.35 | 61.35 | 61.35 | 61.35 |
| Inventories | 146.2 | 241.3 | 192.1 | 199.0 | 170.8 | 183.8 | 188.1 | 192.6 | 197.1 | 201.8 |
| Inventories, % | 10.14 | 20.08 | 17.93 | 10.99 | 13.89 | 14.61 | 14.61 | 14.61 | 14.61 | 14.61 |
| Accounts Payable | 34.0 | 63.9 | 24.8 | 17.5 | 13.8 | 30.4 | 31.1 | 31.8 | 32.6 | 33.4 |
| Accounts Payable, % | 2.36 | 5.32 | 2.31 | 0.96529 | 1.12 | 2.42 | 2.42 | 2.42 | 2.42 | 2.42 |
| Capital Expenditure | -335.7 | -632.9 | -290.7 | -470.7 | -542.4 | -435.8 | -446.1 | -456.7 | -467.5 | -478.5 |
| Capital Expenditure, % | -23.29 | -52.65 | -27.13 | -25.98 | -44.13 | -34.64 | -34.64 | -34.64 | -34.64 | -34.64 |
| Tax Rate, % | 9.26 | 9.26 | 9.26 | 9.26 | 9.26 | 9.26 | 9.26 | 9.26 | 9.26 | 9.26 |
| EBITAT | 418.2 | 245.0 | 181.4 | 501.2 | 233.5 | 286.0 | 292.8 | 299.7 | 306.8 | 314.0 |
| Depreciation | ||||||||||
| Changes in Account Receivables | ||||||||||
| Changes in Inventories | ||||||||||
| Changes in Accounts Payable | ||||||||||
| Capital Expenditure | ||||||||||
| UFCF | -703.4 | -414.6 | -230.0 | 1,056.6 | -1,558.9 | 568.7 | -95.4 | -97.7 | -100.0 | -102.3 |
| WACC, % | 4.67 | 4.67 | 4.67 | 4.67 | 4.67 | 4.67 | 4.67 | 4.67 | 4.67 | 4.67 |
| PV UFCF | ||||||||||
| SUM PV UFCF | 206.3 | |||||||||
| Long Term Growth Rate, % | 2.00 | |||||||||
| Free cash flow (T + 1) | -104 | |||||||||
| Terminal Value | -3,910 | |||||||||
| Present Terminal Value | -3,112 | |||||||||
| Enterprise Value | -2,906 | |||||||||
| Net Debt | -242 | |||||||||
| Equity Value | -2,664 | |||||||||
| Diluted Shares Outstanding, MM | 414 | |||||||||
| Equity Value Per Share | -6.43 |
What You Will Receive
- Authentic BCHT Financial Data: Pre-filled with Changchun BCHT Biotechnology's historical and projected figures for accurate analysis.
- Fully Customizable Template: Easily adjust key metrics like revenue growth, WACC, and EBITDA % as needed.
- Real-Time Calculations: Watch the intrinsic value of Changchun BCHT Biotechnology (688276SS) update immediately based on your modifications.
- Comprehensive Valuation Tool: Tailored for investors, analysts, and consultants pursuing precise DCF results.
- Intuitive Layout: User-friendly structure and straightforward instructions suitable for all skill levels.
Key Features
- Comprehensive BCHT Data: Equipped with Changchun BCHT Biotechnology's historical financials and future projections.
- Fully Customizable Inputs: Tailor revenue growth, profit margins, WACC, tax rates, and capital expenditures to your preferences.
- Dynamic Valuation Model: Instant updates to Net Present Value (NPV) and intrinsic value based on user-defined inputs.
- Scenario Analysis: Generate various forecasting scenarios to explore different valuation results.
- User-Friendly Interface: Intuitive and well-organized, designed for both experienced professionals and newcomers.
How It Works
- Step 1: Download the Excel file for Changchun BCHT Biotechnology Co. (688276SS).
- Step 2: Examine the pre-filled financial data and forecasts specific to BCHT.
- Step 3: Adjust key inputs such as revenue growth, WACC, and tax rates (highlighted cells).
- Step 4: Observe the DCF model update in real-time as you modify your assumptions.
- Step 5: Review the outputs and leverage the results to inform your investment decisions.
Why Select This Calculator for Changchun BCHT Biotechnology Co. (688276SS)?
- All-in-One Solution: Combines DCF, WACC, and financial ratio analyses for a complete assessment.
- Tailored Inputs: Modify the yellow-highlighted fields to evaluate different scenarios.
- In-Depth Analysis: Automatically computes the intrinsic value and Net Present Value for Changchun BCHT.
- Preloaded Information: Comes with historical and projected data for reliable analysis.
- Expert-Level Features: Perfect for financial analysts, investors, and business advisors.
Who Can Benefit from This Product?
- Biotechnology Students: Discover research methodologies and apply them to real-world case studies.
- Researchers: Utilize advanced models in your studies or innovative projects.
- Investors: Evaluate your strategies and assess valuation predictions for Changchun BCHT Biotechnology Co. (688276SS).
- Market Analysts: Enhance your analysis with a customizable and ready-to-use financial model.
- Entrepreneurs: Learn from the analysis techniques used for leading biotechnology firms like Changchun BCHT Biotechnology Co. (688276SS).
What the Template Contains
- Historical Data: Features Changchun BCHT Biotechnology Co.’s past financials and baseline forecasts.
- DCF and Levered DCF Models: Comprehensive templates for assessing the intrinsic value of Changchun BCHT Biotechnology Co. (688276SS).
- WACC Sheet: Pre-configured calculations for the Weighted Average Cost of Capital.
- Editable Inputs: Adjust key factors such as growth rates, EBITDA %, and CAPEX assumptions.
- Quarterly and Annual Statements: An exhaustive overview of Changchun BCHT Biotechnology Co.’s financial performance.
- Interactive Dashboard: Dynamically visualize valuation results and future projections.
Disclaimer
All information, articles, and product details provided on this website are for general informational and educational purposes only. We do not claim any ownership over, nor do we intend to infringe upon, any trademarks, copyrights, logos, brand names, or other intellectual property mentioned or depicted on this site. Such intellectual property remains the property of its respective owners, and any references here are made solely for identification or informational purposes, without implying any affiliation, endorsement, or partnership.
We make no representations or warranties, express or implied, regarding the accuracy, completeness, or suitability of any content or products presented. Nothing on this website should be construed as legal, tax, investment, financial, medical, or other professional advice. In addition, no part of this site—including articles or product references—constitutes a solicitation, recommendation, endorsement, advertisement, or offer to buy or sell any securities, franchises, or other financial instruments, particularly in jurisdictions where such activity would be unlawful.
All content is of a general nature and may not address the specific circumstances of any individual or entity. It is not a substitute for professional advice or services. Any actions you take based on the information provided here are strictly at your own risk. You accept full responsibility for any decisions or outcomes arising from your use of this website and agree to release us from any liability in connection with your use of, or reliance upon, the content or products found herein.