
|
Sansure Biotech Inc. (688289.ss) Valoración de DCF |
Completamente Editable: Adáptelo A Sus Necesidades En Excel O Sheets
Diseño Profesional: Plantillas Confiables Y Estándares De La Industria
Predeterminadas Para Un Uso Rápido Y Eficiente
Compatible con MAC / PC, completamente desbloqueado
No Se Necesita Experiencia; Fáciles De Seguir
Sansure Biotech Inc. (688289.SS) Bundle
¡Evalúe la perspectiva financiera de Sansure Biotech Inc. con la confianza! Esta calculadora DCF (688289SS) viene con finanzas precargadas y ofrece una flexibilidad total para modificar el crecimiento de los ingresos, WACC, los márgenes y otros supuestos esenciales para alinearse con sus proyecciones.
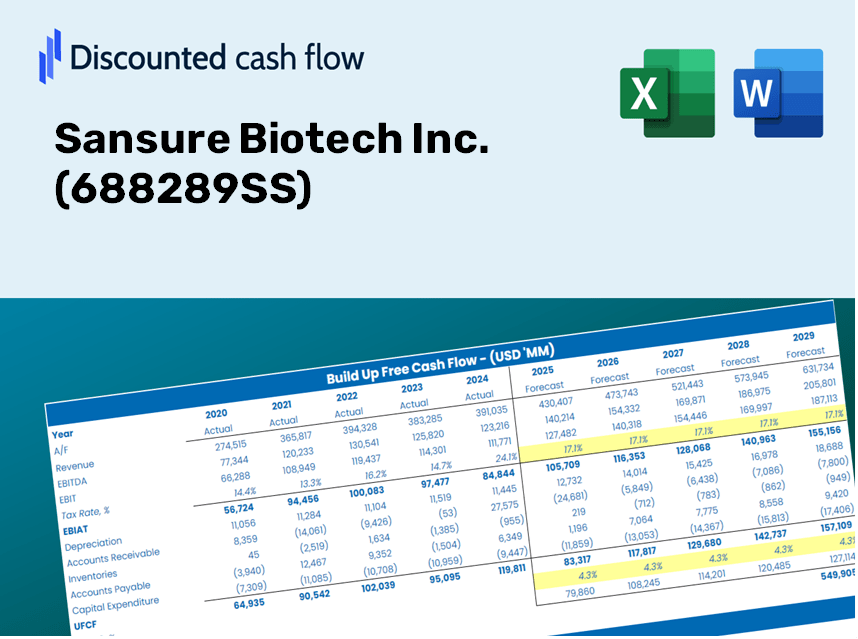
Discounted Cash Flow (DCF) - (USD MM)
| Year | AY1 2020 |
AY2 2021 |
AY3 2022 |
AY4 2023 |
AY5 2024 |
FY1 2025 |
FY2 2026 |
FY3 2027 |
FY4 2028 |
FY5 2029 |
|---|---|---|---|---|---|---|---|---|---|---|
| Revenue | 4,763.0 | 4,514.5 | 6,450.4 | 1,007.1 | 1,458.1 | 1,451.0 | 1,443.9 | 1,436.9 | 1,429.9 | 1,422.9 |
| Revenue Growth, % | 0 | -5.22 | 42.88 | -84.39 | 44.78 | -0.48681 | -0.48681 | -0.48681 | -0.48681 | -0.48681 |
| EBITDA | 3,096.4 | 2,571.5 | 2,269.5 | 79.8 | 267.9 | 532.4 | 529.8 | 527.2 | 524.6 | 522.1 |
| EBITDA, % | 65.01 | 56.96 | 35.18 | 7.92 | 18.37 | 36.69 | 36.69 | 36.69 | 36.69 | 36.69 |
| Depreciation | 26.7 | 45.9 | 75.5 | 100.9 | 140.6 | 65.0 | 64.7 | 64.4 | 64.1 | 63.8 |
| Depreciation, % | 0.56024 | 1.02 | 1.17 | 10.02 | 9.65 | 4.48 | 4.48 | 4.48 | 4.48 | 4.48 |
| EBIT | 3,069.7 | 2,525.6 | 2,194.0 | -21.1 | 127.3 | 467.3 | 465.1 | 462.8 | 460.5 | 458.3 |
| EBIT, % | 64.45 | 55.94 | 34.01 | -2.09 | 8.73 | 32.21 | 32.21 | 32.21 | 32.21 | 32.21 |
| Total Cash | 4,192.0 | 4,682.7 | 5,663.8 | 4,781.8 | 4,729.8 | 1,380.8 | 1,374.1 | 1,367.4 | 1,360.7 | 1,354.1 |
| Total Cash, percent | .0 | .0 | .0 | .0 | .0 | .0 | .0 | .0 | .0 | .0 |
| Account Receivables | 546.4 | 822.0 | 1,298.1 | 692.3 | 588.3 | 461.1 | 458.8 | 456.6 | 454.4 | 452.2 |
| Account Receivables, % | 11.47 | 18.21 | 20.12 | 68.74 | 40.35 | 31.78 | 31.78 | 31.78 | 31.78 | 31.78 |
| Inventories | 276.7 | 369.5 | 355.3 | 376.6 | 392.8 | 243.3 | 242.1 | 240.9 | 239.8 | 238.6 |
| Inventories, % | 5.81 | 8.18 | 5.51 | 37.4 | 26.94 | 16.77 | 16.77 | 16.77 | 16.77 | 16.77 |
| Accounts Payable | 272.3 | 258.7 | 791.4 | 468.7 | 395.4 | 282.6 | 281.2 | 279.8 | 278.5 | 277.1 |
| Accounts Payable, % | 5.72 | 5.73 | 12.27 | 46.53 | 27.12 | 19.47 | 19.47 | 19.47 | 19.47 | 19.47 |
| Capital Expenditure | -108.7 | -372.9 | -558.8 | -391.3 | -421.1 | -252.3 | -251.1 | -249.9 | -248.6 | -247.4 |
| Capital Expenditure, % | -2.28 | -8.26 | -8.66 | -38.86 | -28.88 | -17.39 | -17.39 | -17.39 | -17.39 | -17.39 |
| Tax Rate, % | -5.75 | -5.75 | -5.75 | -5.75 | -5.75 | -5.75 | -5.75 | -5.75 | -5.75 | -5.75 |
| EBITAT | 2,616.2 | 2,165.0 | 1,834.9 | -18.7 | 134.6 | 414.2 | 412.2 | 410.2 | 408.2 | 406.2 |
| Depreciation | ||||||||||
| Changes in Account Receivables | ||||||||||
| Changes in Inventories | ||||||||||
| Changes in Accounts Payable | ||||||||||
| Capital Expenditure | ||||||||||
| UFCF | 1,983.4 | 1,456.1 | 1,422.3 | -47.4 | -131.2 | 390.7 | 227.9 | 226.8 | 225.7 | 224.6 |
| WACC, % | 7.44 | 7.44 | 7.44 | 7.45 | 7.47 | 7.45 | 7.45 | 7.45 | 7.45 | 7.45 |
| PV UFCF | ||||||||||
| SUM PV UFCF | 1,070.0 | |||||||||
| Long Term Growth Rate, % | 0.50 | |||||||||
| Free cash flow (T + 1) | 226 | |||||||||
| Terminal Value | 3,248 | |||||||||
| Present Terminal Value | 2,268 | |||||||||
| Enterprise Value | 3,338 | |||||||||
| Net Debt | -4,173 | |||||||||
| Equity Value | 7,510 | |||||||||
| Diluted Shares Outstanding, MM | 589 | |||||||||
| Equity Value Per Share | 12.76 |
What You Will Receive
- Authentic Sansure Biotech Financial Data: Pre-loaded with historical and projected figures for in-depth analysis.
- Completely Customizable Template: Effortlessly adjust essential inputs like revenue growth, WACC, and EBITDA percentage.
- Instantaneous Calculations: Watch as Sansure Biotech's intrinsic value updates in real-time with your modifications.
- Expert Valuation Tool: Crafted for investors, analysts, and consultants aiming for precise DCF outcomes.
- Intuitive User Interface: Clear layout and straightforward guidance suitable for all skill levels.
Key Features
- Customizable Forecast Inputs: Adjust vital parameters such as revenue growth, EBITDA margin, and capital investments.
- Instant DCF Valuation: Quickly calculates intrinsic value, NPV, and additional financial metrics.
- High-Precision Accuracy: Leverages Sansure Biotech Inc.'s (688289SS) actual financial data for precise valuation results.
- Simplified Scenario Analysis: Effortlessly evaluate various assumptions and analyze results side by side.
- Efficiency Booster: Streamlines the process by eliminating the need for intricate valuation models from the ground up.
How It Functions
- Step 1: Download the Excel file.
- Step 2: Examine the pre-filled Sansure Biotech data (historical and projected).
- Step 3: Modify key assumptions (highlighted in yellow) according to your analysis.
- Step 4: Observe automatic recalculations for Sansure Biotech’s intrinsic value.
- Step 5: Utilize the results for investment decisions or financial reporting.
Why Choose This Calculator for Sansure Biotech Inc. (688289SS)?
- User-Friendly Interface: Perfectly crafted for both novices and seasoned professionals.
- Customizable Parameters: Effortlessly adjust inputs to suit your analysis needs.
- Real-Time Adjustments: Witness immediate updates to Sansure's valuation as you make changes.
- Pre-Loaded Data: Comes equipped with Sansure's actual financial figures for swift evaluation.
- Recommended by Experts: Widely utilized by investors and analysts for strategic decision-making.
Who Can Benefit from This Product?
- Professional Investors: Develop comprehensive and trustworthy valuation models for portfolio evaluation related to Sansure Biotech Inc. (688289SS).
- Corporate Finance Teams: Assess valuation scenarios to inform strategic decisions within the organization.
- Consultants and Advisors: Deliver precise valuation insights regarding Sansure Biotech Inc. (688289SS) to clients.
- Students and Educators: Utilize real-world data to enhance learning and practice in financial modeling.
- Biotech Enthusiasts: Gain insights into how biotech companies like Sansure Biotech Inc. (688289SS) are appraised in the marketplace.
What the Template Includes
- Preloaded Sansure Biotech Data: Historical and projected financial figures, encompassing revenue, EBIT, and capital expenditures.
- DCF and WACC Models: Advanced spreadsheets for determining intrinsic value and Weighted Average Cost of Capital.
- Editable Inputs: Yellow-highlighted cells for modifying revenue growth, tax rates, and discount rates.
- Financial Statements: Detailed annual and quarterly financial data for thorough analysis.
- Key Ratios: Metrics for profitability, leverage, and efficiency to assess performance.
- Dashboard and Charts: Visual representations of valuation results and underlying assumptions.
Disclaimer
All information, articles, and product details provided on this website are for general informational and educational purposes only. We do not claim any ownership over, nor do we intend to infringe upon, any trademarks, copyrights, logos, brand names, or other intellectual property mentioned or depicted on this site. Such intellectual property remains the property of its respective owners, and any references here are made solely for identification or informational purposes, without implying any affiliation, endorsement, or partnership.
We make no representations or warranties, express or implied, regarding the accuracy, completeness, or suitability of any content or products presented. Nothing on this website should be construed as legal, tax, investment, financial, medical, or other professional advice. In addition, no part of this site—including articles or product references—constitutes a solicitation, recommendation, endorsement, advertisement, or offer to buy or sell any securities, franchises, or other financial instruments, particularly in jurisdictions where such activity would be unlawful.
All content is of a general nature and may not address the specific circumstances of any individual or entity. It is not a substitute for professional advice or services. Any actions you take based on the information provided here are strictly at your own risk. You accept full responsibility for any decisions or outcomes arising from your use of this website and agree to release us from any liability in connection with your use of, or reliance upon, the content or products found herein.