
|
Kede Numerical Control Co., Ltd. (688305.ss) Valoración de DCF |
Completamente Editable: Adáptelo A Sus Necesidades En Excel O Sheets
Diseño Profesional: Plantillas Confiables Y Estándares De La Industria
Predeterminadas Para Un Uso Rápido Y Eficiente
Compatible con MAC / PC, completamente desbloqueado
No Se Necesita Experiencia; Fáciles De Seguir
KEDE Numerical Control Co., Ltd. (688305.SS) Bundle
¡Explore las perspectivas financieras de Kede Numerical Control Co., Ltd. (688305SS) con nuestra calculadora DCF fácil de usar! Ingrese sus supuestos sobre el crecimiento, los márgenes y los gastos para calcular el valor intrínseco de Kede Numerical Control Co., Ltd. (688305SS) y mejorar su estrategia de inversión.
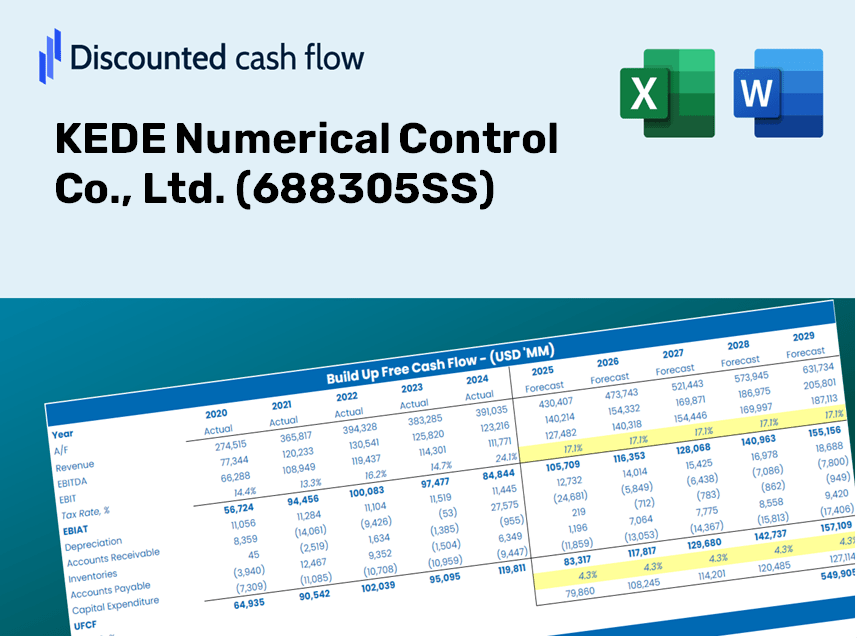
Discounted Cash Flow (DCF) - (USD MM)
| Year | AY1 2020 |
AY2 2021 |
AY3 2022 |
AY4 2023 |
AY5 2024 |
FY1 2025 |
FY2 2026 |
FY3 2027 |
FY4 2028 |
FY5 2029 |
|---|---|---|---|---|---|---|---|---|---|---|
| Revenue | 198.1 | 253.6 | 315.4 | 452.3 | 605.5 | 801.7 | 1,061.5 | 1,405.5 | 1,861.0 | 2,464.2 |
| Revenue Growth, % | 0 | 27.99 | 24.39 | 43.37 | 33.88 | 32.41 | 32.41 | 32.41 | 32.41 | 32.41 |
| EBITDA | 48.4 | 74.9 | 79.3 | 128.4 | 185.8 | 221.5 | 293.3 | 388.4 | 514.3 | 681.0 |
| EBITDA, % | 24.41 | 29.54 | 25.14 | 28.39 | 30.69 | 27.63 | 27.63 | 27.63 | 27.63 | 27.63 |
| Depreciation | 13.3 | 19.0 | 22.4 | 29.7 | 47.2 | 57.2 | 75.7 | 100.3 | 132.8 | 175.8 |
| Depreciation, % | 6.72 | 7.5 | 7.1 | 6.56 | 7.79 | 7.14 | 7.14 | 7.14 | 7.14 | 7.14 |
| EBIT | 35.0 | 55.9 | 56.9 | 98.7 | 138.6 | 164.3 | 217.6 | 288.1 | 381.5 | 505.1 |
| EBIT, % | 17.69 | 22.05 | 18.04 | 21.83 | 22.89 | 20.5 | 20.5 | 20.5 | 20.5 | 20.5 |
| Total Cash | 140.8 | 186.1 | 301.5 | 245.7 | 498.4 | 604.0 | 799.7 | 1,058.9 | 1,402.0 | 1,856.4 |
| Total Cash, percent | .0 | .0 | .0 | .0 | .0 | .0 | .0 | .0 | .0 | .0 |
| Account Receivables | 99.0 | 140.5 | 196.4 | 186.0 | 258.4 | 403.1 | 533.8 | 706.8 | 935.9 | 1,239.1 |
| Account Receivables, % | 49.96 | 55.41 | 62.25 | 41.14 | 42.68 | 50.29 | 50.29 | 50.29 | 50.29 | 50.29 |
| Inventories | 183.6 | 300.5 | 394.0 | 471.5 | 541.1 | 772.9 | 1,023.4 | 1,355.0 | 1,794.2 | 2,375.7 |
| Inventories, % | 92.68 | 118.51 | 124.9 | 104.25 | 89.37 | 96.41 | 96.41 | 96.41 | 96.41 | 96.41 |
| Accounts Payable | 15.8 | 40.0 | 107.7 | 181.8 | 242.2 | 221.3 | 293.1 | 388.1 | 513.8 | 680.3 |
| Accounts Payable, % | 7.95 | 15.77 | 34.13 | 40.21 | 40 | 27.61 | 27.61 | 27.61 | 27.61 | 27.61 |
| Capital Expenditure | -24.7 | -67.8 | -61.2 | -96.8 | -413.5 | -237.8 | -314.9 | -416.9 | -552.1 | -731.0 |
| Capital Expenditure, % | -12.45 | -26.75 | -19.41 | -21.4 | -68.3 | -29.66 | -29.66 | -29.66 | -29.66 | -29.66 |
| Tax Rate, % | 12.63 | 12.63 | 12.63 | 12.63 | 12.63 | 12.63 | 12.63 | 12.63 | 12.63 | 12.63 |
| EBITAT | 31.6 | 49.1 | 52.6 | 87.8 | 121.1 | 146.9 | 194.4 | 257.5 | 340.9 | 451.4 |
| Depreciation | ||||||||||
| Changes in Account Receivables | ||||||||||
| Changes in Inventories | ||||||||||
| Changes in Accounts Payable | ||||||||||
| Capital Expenditure | ||||||||||
| UFCF | -246.6 | -134.0 | -67.8 | 27.7 | -326.9 | -431.1 | -354.1 | -468.9 | -620.8 | -822.0 |
| WACC, % | 6.46 | 6.46 | 6.46 | 6.46 | 6.46 | 6.46 | 6.46 | 6.46 | 6.46 | 6.46 |
| PV UFCF | ||||||||||
| SUM PV UFCF | -2,190.6 | |||||||||
| Long Term Growth Rate, % | 2.00 | |||||||||
| Free cash flow (T + 1) | -838 | |||||||||
| Terminal Value | -18,813 | |||||||||
| Present Terminal Value | -13,759 | |||||||||
| Enterprise Value | -15,950 | |||||||||
| Net Debt | -377 | |||||||||
| Equity Value | -15,573 | |||||||||
| Diluted Shares Outstanding, MM | 99 | |||||||||
| Equity Value Per Share | -157.45 |
Benefits of Choosing KEDE Numerical Control Co., Ltd. (688305SS)
- Comprehensive Financial Model: Leverage KEDE's real financial data for accurate DCF analysis.
- Complete Forecasting Flexibility: Modify revenue growth, profit margins, WACC, and other essential factors.
- Real-Time Calculations: Instantaneous updates allow you to view results immediately as you adjust inputs.
- Professional-Grade Template: An expertly crafted Excel file ready for serious investor presentations.
- Adaptable and Repeatable: Designed for easy customization, perfect for ongoing detailed projections.
Key Features
- Genuine KEDE Financial Data: Gain access to precise historical information and future forecasts.
- Customizable Forecast Parameters: Modify yellow-highlighted fields such as WACC, growth rates, and profit margins.
- Real-time Calculations: Automatic updates for DCF, Net Present Value (NPV), and cash flow assessments.
- Interactive Dashboard: Simple-to-understand charts and summaries to help illustrate your valuation findings.
- Designed for All Levels: An easy-to-navigate format tailored for investors, CFOs, and consultants alike.
How It Works
- Step 1: Download the prebuilt Excel template containing KEDE Numerical Control Co., Ltd. (688305SS) data.
- Step 2: Navigate through the pre-filled sheets to familiarize yourself with the essential metrics.
- Step 3: Adjust forecasts and assumptions in the editable yellow cells (WACC, growth, margins).
- Step 4: Observe the updated results instantly, including the intrinsic value of KEDE Numerical Control Co., Ltd. (688305SS).
- Step 5: Use the outputs to make well-informed investment choices or create comprehensive reports.
Why Select KEDE Numerical Control Co., Ltd. ([688305SS])?
- All-in-One Solution: Combines DCF, WACC, and financial ratio analyses into a single comprehensive tool.
- Flexible Configurations: Modify the highlighted cells to explore different financial scenarios.
- In-Depth Analysis: Automatically computes KEDE’s intrinsic value and Net Present Value for informed decision-making.
- Preloaded Information: Access historical and projected data for reliable analysis from the start.
- High-Quality Standards: Designed for financial analysts, investors, and business consultants seeking precision.
Who Can Benefit From Our Solutions?
- Manufacturing Students: Master CNC programming and apply your skills with hands-on projects.
- Researchers: Utilize advanced numerical control models in your studies or papers.
- Industry Professionals: Validate your production strategies and assess efficiency outcomes for KEDE Numerical Control Co., Ltd. (688305SS).
- Engineers: Enhance productivity with our ready-to-use, customizable CNC programming tools.
- Entrepreneurs: Discover how major players in the industry, like KEDE, optimize their manufacturing processes.
What the Template Includes
- Preloaded KEDE Data: Historical and projected financial metrics, such as revenue, EBIT, and capital expenditures.
- DCF and WACC Models: Advanced spreadsheets for determining intrinsic value and Weighted Average Cost of Capital.
- Customizable Inputs: Yellow-highlighted cells for modifying revenue growth rates, tax obligations, and discount rates.
- Financial Statements: Detailed annual and quarterly financial reports for in-depth analysis.
- Key Ratios: Metrics for profitability, leverage, and efficiency to assess company performance.
- Dashboard and Charts: Visual representations of valuation results and underlying assumptions.
Disclaimer
All information, articles, and product details provided on this website are for general informational and educational purposes only. We do not claim any ownership over, nor do we intend to infringe upon, any trademarks, copyrights, logos, brand names, or other intellectual property mentioned or depicted on this site. Such intellectual property remains the property of its respective owners, and any references here are made solely for identification or informational purposes, without implying any affiliation, endorsement, or partnership.
We make no representations or warranties, express or implied, regarding the accuracy, completeness, or suitability of any content or products presented. Nothing on this website should be construed as legal, tax, investment, financial, medical, or other professional advice. In addition, no part of this site—including articles or product references—constitutes a solicitation, recommendation, endorsement, advertisement, or offer to buy or sell any securities, franchises, or other financial instruments, particularly in jurisdictions where such activity would be unlawful.
All content is of a general nature and may not address the specific circumstances of any individual or entity. It is not a substitute for professional advice or services. Any actions you take based on the information provided here are strictly at your own risk. You accept full responsibility for any decisions or outcomes arising from your use of this website and agree to release us from any liability in connection with your use of, or reliance upon, the content or products found herein.