
|
Guangdong Jiayuan Technology Co., Ltd. (688388.ss) Valoración de DCF |
Completamente Editable: Adáptelo A Sus Necesidades En Excel O Sheets
Diseño Profesional: Plantillas Confiables Y Estándares De La Industria
Predeterminadas Para Un Uso Rápido Y Eficiente
Compatible con MAC / PC, completamente desbloqueado
No Se Necesita Experiencia; Fáciles De Seguir
Guangdong Jiayuan Technology Co.,Ltd. (688388.SS) Bundle
¿Busca evaluar el valor intrínseco de Guangdong Jiayuan Technology Co., Ltd.? Nuestra calculadora DCF (688388SS) integra datos del mundo real con extensas funciones de personalización, lo que le permite refinar proyecciones y mejorar sus opciones de inversión.
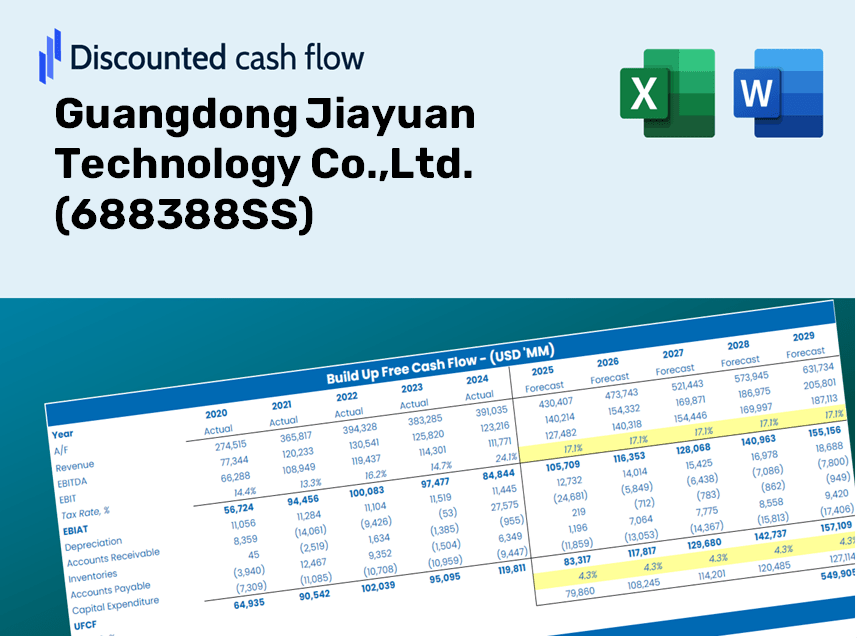
Discounted Cash Flow (DCF) - (USD MM)
| Year | AY1 2020 |
AY2 2021 |
AY3 2022 |
AY4 2023 |
AY5 2024 |
FY1 2025 |
FY2 2026 |
FY3 2027 |
FY4 2028 |
FY5 2029 |
|---|---|---|---|---|---|---|---|---|---|---|
| Revenue | 1,202.2 | 2,804.2 | 4,640.8 | 4,968.6 | 6,522.3 | 6,784.4 | 7,057.2 | 7,340.8 | 7,635.9 | 7,942.9 |
| Revenue Growth, % | 0 | 133.26 | 65.5 | 7.06 | 31.27 | 4.02 | 4.02 | 4.02 | 4.02 | 4.02 |
| EBITDA | 219.4 | 682.6 | 839.5 | 315.9 | 103.8 | 931.3 | 968.7 | 1,007.7 | 1,048.2 | 1,090.3 |
| EBITDA, % | 18.25 | 24.34 | 18.09 | 6.36 | 1.59 | 13.73 | 13.73 | 13.73 | 13.73 | 13.73 |
| Depreciation | 48.4 | 74.3 | 131.1 | 240.6 | 297.0 | 256.4 | 266.7 | 277.4 | 288.6 | 300.2 |
| Depreciation, % | 4.03 | 2.65 | 2.82 | 4.84 | 4.55 | 3.78 | 3.78 | 3.78 | 3.78 | 3.78 |
| EBIT | 171.0 | 608.3 | 708.4 | 75.3 | -193.1 | 674.9 | 702.0 | 730.2 | 759.6 | 790.1 |
| EBIT, % | 14.22 | 21.69 | 15.26 | 1.52 | -2.96 | 9.95 | 9.95 | 9.95 | 9.95 | 9.95 |
| Total Cash | 1,070.0 | 1,726.1 | 2,567.6 | 2,578.5 | 2,022.3 | 3,918.6 | 4,076.1 | 4,240.0 | 4,410.4 | 4,587.7 |
| Total Cash, percent | .0 | .0 | .0 | .0 | .0 | .0 | .0 | .0 | .0 | .0 |
| Account Receivables | 302.8 | 707.2 | 1,186.2 | 1,230.7 | 1,897.6 | 1,761.7 | 1,832.5 | 1,906.2 | 1,982.8 | 2,062.5 |
| Account Receivables, % | 25.19 | 25.22 | 25.56 | 24.77 | 29.09 | 25.97 | 25.97 | 25.97 | 25.97 | 25.97 |
| Inventories | 150.0 | 323.2 | 936.6 | 954.2 | 1,370.7 | 1,145.2 | 1,191.3 | 1,239.2 | 1,289.0 | 1,340.8 |
| Inventories, % | 12.48 | 11.52 | 20.18 | 19.2 | 21.02 | 16.88 | 16.88 | 16.88 | 16.88 | 16.88 |
| Accounts Payable | 74.2 | 294.0 | 814.1 | 2,191.4 | 1,132.2 | 1,298.0 | 1,350.1 | 1,404.4 | 1,460.9 | 1,519.6 |
| Accounts Payable, % | 6.17 | 10.48 | 17.54 | 44.11 | 17.36 | 19.13 | 19.13 | 19.13 | 19.13 | 19.13 |
| Capital Expenditure | -515.9 | -1,182.9 | -2,577.1 | -1,281.9 | -735.7 | -2,411.2 | -2,508.2 | -2,609.0 | -2,713.9 | -2,823.0 |
| Capital Expenditure, % | -42.91 | -42.18 | -55.53 | -25.8 | -11.28 | -35.54 | -35.54 | -35.54 | -35.54 | -35.54 |
| Tax Rate, % | 15.84 | 15.84 | 15.84 | 15.84 | 15.84 | 15.84 | 15.84 | 15.84 | 15.84 | 15.84 |
| EBITAT | 150.8 | 529.7 | 577.5 | 58.2 | -162.5 | 564.4 | 587.1 | 610.7 | 635.3 | 660.8 |
| Depreciation | ||||||||||
| Changes in Account Receivables | ||||||||||
| Changes in Inventories | ||||||||||
| Changes in Accounts Payable | ||||||||||
| Capital Expenditure | ||||||||||
| UFCF | -695.3 | -936.6 | -2,440.9 | 332.2 | -2,744.1 | -1,063.2 | -1,719.0 | -1,788.1 | -1,860.0 | -1,934.8 |
| WACC, % | 7.83 | 7.83 | 7.78 | 7.75 | 7.8 | 7.8 | 7.8 | 7.8 | 7.8 | 7.8 |
| PV UFCF | ||||||||||
| SUM PV UFCF | -6,599.4 | |||||||||
| Long Term Growth Rate, % | 3.00 | |||||||||
| Free cash flow (T + 1) | -1,993 | |||||||||
| Terminal Value | -41,524 | |||||||||
| Present Terminal Value | -28,525 | |||||||||
| Enterprise Value | -35,124 | |||||||||
| Net Debt | 1,997 | |||||||||
| Equity Value | -37,121 | |||||||||
| Diluted Shares Outstanding, MM | 424 | |||||||||
| Equity Value Per Share | -87.49 |
Benefits You'll Receive
- Accurate 688388SS Financials: Access both historical data and future projections for precise valuation.
- Customizable Inputs: Adjust parameters such as WACC, tax rates, revenue growth, and capital expenditures as needed.
- Real-Time Calculations: Automatic computation of intrinsic value and NPV as you make changes.
- Scenario Testing: Explore various scenarios to assess the prospective performance of Guangdong Jiayuan Technology Co., Ltd.
- User-Friendly Interface: Designed for industry professionals, yet easy enough for newcomers to navigate.
Key Features
- Real-Time 688388SS Data: Pre-filled with Guangdong Jiayuan Technology Co., Ltd.'s historical financials and future forecasts.
- Completely Customizable Inputs: Modify revenue growth, profit margins, WACC, tax rates, and capital expenditures as needed.
- Adaptive Valuation Model: Automatic recalculations of Net Present Value (NPV) and intrinsic value based on your adjustments.
- Scenario Analysis: Develop various forecasting scenarios to explore distinct valuation possibilities.
- Intuitive Design: Clear, organized layout tailored for both industry professionals and newcomers.
How It Works
- Step 1: Download the prebuilt Excel template featuring Guangdong Jiayuan Technology Co., Ltd.'s data.
- Step 2: Review the pre-filled sheets to familiarize yourself with the essential metrics.
- Step 3: Update your forecasts and assumptions in the editable yellow cells (WACC, growth, margins).
- Step 4: Instantly access recalculated results, including the intrinsic value of Guangdong Jiayuan Technology Co., Ltd. (688388SS).
- Step 5: Make informed investment choices or create reports based on the outputs.
Why Opt for Our Financial Calculator?
- All-in-One Solution: Combines DCF, WACC, and financial ratio analyses into a single tool.
- Flexible Customization: Modify yellow-highlighted cells to explore different financial scenarios.
- In-Depth Analysis: Automatically derives Guangdong Jiayuan Technology Co., Ltd.'s intrinsic value and Net Present Value.
- Pre-Loaded Information: Historical and projected data provide reliable starting references.
- High Professional Standards: Perfect for financial analysts, investors, and business consultants alike.
Who Can Benefit from Guangdong Jiayuan Technology Co., Ltd. (688388SS)?
- Students in Technology and Engineering: Acquire practical skills by exploring cutting-edge technologies and real-world applications.
- Researchers: Integrate advanced technological frameworks into academic projects or studies.
- Investors: Evaluate market trends and assess investment opportunities related to Guangdong Jiayuan Technology Co., Ltd. (688388SS).
- Industry Analysts: Enhance your analysis with robust data and customizable evaluation models tailored to tech companies.
- Entrepreneurs: Discover how leading tech firms operate and analyze successful business strategies.
Contents of the Template
- Pre-Filled DCF Model: Guangdong Jiayuan Technology’s financial data preloaded for immediate application.
- WACC Calculator: Comprehensive calculations for Weighted Average Cost of Capital.
- Financial Ratios: Analyze Guangdong Jiayuan Technology's profitability, leverage, and efficiency.
- Editable Inputs: Modify assumptions such as growth rates, margins, and capital expenditures to suit your scenarios.
- Financial Statements: Annual and quarterly reports to facilitate in-depth analysis.
- Interactive Dashboard: Effortlessly visualize key valuation metrics and outcomes.
Disclaimer
All information, articles, and product details provided on this website are for general informational and educational purposes only. We do not claim any ownership over, nor do we intend to infringe upon, any trademarks, copyrights, logos, brand names, or other intellectual property mentioned or depicted on this site. Such intellectual property remains the property of its respective owners, and any references here are made solely for identification or informational purposes, without implying any affiliation, endorsement, or partnership.
We make no representations or warranties, express or implied, regarding the accuracy, completeness, or suitability of any content or products presented. Nothing on this website should be construed as legal, tax, investment, financial, medical, or other professional advice. In addition, no part of this site—including articles or product references—constitutes a solicitation, recommendation, endorsement, advertisement, or offer to buy or sell any securities, franchises, or other financial instruments, particularly in jurisdictions where such activity would be unlawful.
All content is of a general nature and may not address the specific circumstances of any individual or entity. It is not a substitute for professional advice or services. Any actions you take based on the information provided here are strictly at your own risk. You accept full responsibility for any decisions or outcomes arising from your use of this website and agree to release us from any liability in connection with your use of, or reliance upon, the content or products found herein.