
|
Genew Technologies Co., Ltd. (688418.ss) Valoración de DCF |
Completamente Editable: Adáptelo A Sus Necesidades En Excel O Sheets
Diseño Profesional: Plantillas Confiables Y Estándares De La Industria
Predeterminadas Para Un Uso Rápido Y Eficiente
Compatible con MAC / PC, completamente desbloqueado
No Se Necesita Experiencia; Fáciles De Seguir
Genew Technologies Co.,Ltd. (688418.SS) Bundle
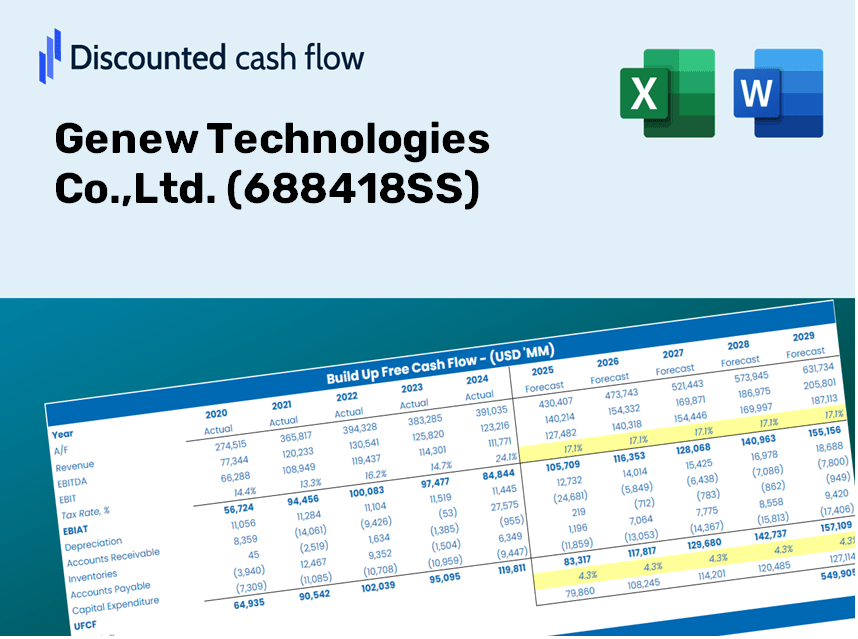
Ya sea que sea un inversor o analista, esta calculadora DCF (688418SS) es su recurso de referencia para una valoración precisa. Precedidos con datos reales de Genew Technologies Co., Ltd., puede ajustar los pronósticos y observar los efectos en tiempo real.
Discounted Cash Flow (DCF) - (USD MM)
| Year | AY1 2020 |
AY2 2021 |
AY3 2022 |
AY4 2023 |
AY5 2024 |
FY1 2025 |
FY2 2026 |
FY3 2027 |
FY4 2028 |
FY5 2029 |
|---|---|---|---|---|---|---|---|---|---|---|
| Revenue | 499.9 | 464.3 | 532.5 | 884.4 | 951.7 | 1,145.0 | 1,377.6 | 1,657.5 | 1,994.2 | 2,399.3 |
| Revenue Growth, % | 0 | -7.12 | 14.68 | 66.1 | 7.6 | 20.32 | 20.32 | 20.32 | 20.32 | 20.32 |
| EBITDA | 57.5 | -80.5 | -173.9 | -16.8 | 115.5 | -64.7 | -77.8 | -93.7 | -112.7 | -135.6 |
| EBITDA, % | 11.49 | -17.34 | -32.65 | -1.9 | 12.14 | -5.65 | -5.65 | -5.65 | -5.65 | -5.65 |
| Depreciation | 8.9 | 25.2 | 43.5 | 60.7 | 59.6 | 65.3 | 78.5 | 94.5 | 113.7 | 136.8 |
| Depreciation, % | 1.79 | 5.43 | 8.16 | 6.87 | 6.26 | 5.7 | 5.7 | 5.7 | 5.7 | 5.7 |
| EBIT | 48.5 | -105.7 | -217.3 | -77.5 | 56.0 | -130.0 | -156.4 | -188.2 | -226.4 | -272.4 |
| EBIT, % | 9.71 | -22.77 | -40.82 | -8.76 | 5.88 | -11.35 | -11.35 | -11.35 | -11.35 | -11.35 |
| Total Cash | 600.7 | 361.1 | 215.6 | 212.8 | 318.7 | 631.6 | 759.9 | 914.3 | 1,100.1 | 1,323.5 |
| Total Cash, percent | .0 | .0 | .0 | .0 | .0 | .0 | .0 | .0 | .0 | .0 |
| Account Receivables | 575.5 | 659.3 | 609.5 | 567.6 | 660.0 | 992.8 | 1,194.5 | 1,437.1 | 1,729.1 | 2,080.4 |
| Account Receivables, % | 115.12 | 142.01 | 114.46 | 64.18 | 69.35 | 86.71 | 86.71 | 86.71 | 86.71 | 86.71 |
| Inventories | 175.3 | 239.1 | 394.9 | 651.6 | 613.9 | 684.5 | 823.6 | 990.9 | 1,192.2 | 1,434.4 |
| Inventories, % | 35.08 | 51.5 | 74.16 | 73.67 | 64.5 | 59.78 | 59.78 | 59.78 | 59.78 | 59.78 |
| Accounts Payable | 125.2 | 157.5 | 119.7 | 357.2 | 258.6 | 341.3 | 410.6 | 494.0 | 594.4 | 715.1 |
| Accounts Payable, % | 25.05 | 33.93 | 22.49 | 40.39 | 27.17 | 29.8 | 29.8 | 29.8 | 29.8 | 29.8 |
| Capital Expenditure | -14.3 | -69.3 | -72.0 | -54.4 | -51.6 | -98.2 | -118.1 | -142.1 | -171.0 | -205.7 |
| Capital Expenditure, % | -2.85 | -14.93 | -13.51 | -6.15 | -5.43 | -8.57 | -8.57 | -8.57 | -8.57 | -8.57 |
| Tax Rate, % | 24.15 | 24.15 | 24.15 | 24.15 | 24.15 | 24.15 | 24.15 | 24.15 | 24.15 | 24.15 |
| EBITAT | 47.7 | -100.5 | -210.2 | -73.0 | 42.4 | -119.6 | -143.9 | -173.2 | -208.4 | -250.7 |
| Depreciation | ||||||||||
| Changes in Account Receivables | ||||||||||
| Changes in Inventories | ||||||||||
| Changes in Accounts Payable | ||||||||||
| Capital Expenditure | ||||||||||
| UFCF | -583.2 | -259.9 | -382.4 | -44.0 | -102.9 | -473.3 | -454.9 | -547.3 | -658.5 | -792.3 |
| WACC, % | 4.74 | 4.73 | 4.74 | 4.73 | 4.67 | 4.72 | 4.72 | 4.72 | 4.72 | 4.72 |
| PV UFCF | ||||||||||
| SUM PV UFCF | -2,519.9 | |||||||||
| Long Term Growth Rate, % | 2.00 | |||||||||
| Free cash flow (T + 1) | -808 | |||||||||
| Terminal Value | -29,675 | |||||||||
| Present Terminal Value | -23,560 | |||||||||
| Enterprise Value | -26,079 | |||||||||
| Net Debt | 11 | |||||||||
| Equity Value | -26,090 | |||||||||
| Diluted Shares Outstanding, MM | 193 | |||||||||
| Equity Value Per Share | -135.50 |
What You Will Receive
- Flexible Input Options: Modify key assumptions (growth %, profit margins, WACC) effortlessly to explore various scenarios.
- Comprehensive Market Data: Financial information for Genew Technologies Co., Ltd. (688418SS) is pre-filled to kickstart your analysis.
- Automated DCF Calculations: The model computes Net Present Value (NPV) and intrinsic value automatically.
- Professional and Adaptable: A sleek Excel model that can be tailored to fit your valuation requirements.
- Designed for Analysts and Investors: Perfect for evaluating forecasts, confirming strategies, and enhancing efficiency.
Key Features
- Customizable Forecast Inputs: Adjust essential metrics such as revenue growth, EBITDA %, and capital expenditures.
- Instant DCF Valuation: Automatically computes intrinsic value, NPV, and other key outputs in real-time.
- High Precision Analytics: Leverages Genew Technologies Co., Ltd.'s (688418SS) actual financial data for accurate valuation results.
- Seamless Scenario Testing: Effortlessly evaluate various assumptions and analyze the resulting outcomes.
- Efficiency-Boosting Tool: Avoid the hassle of constructing intricate valuation models from the ground up.
How It Functions
- 1. Access the Template: Download and open the Excel file containing Genew Technologies Co., Ltd.'s preloaded data.
- 2. Modify Assumptions: Adjust key inputs such as growth rates, WACC, and capital expenditures as needed.
- 3. View Results Immediately: The DCF model automatically computes intrinsic value and NPV in real-time.
- 4. Explore Scenarios: Evaluate multiple forecasts to understand various valuation possibilities.
- 5. Utilize with Assurance: Present professional valuation insights to strengthen your decision-making process.
Why Opt for Genew Technologies Co., Ltd. (688418SS) Calculator?
- Precision: Utilizing authentic financial data from Genew Technologies for optimal accuracy.
- Versatility: Tailored for users to experiment and adjust inputs with ease.
- Efficiency: Eliminate the complexities of creating a DCF model from the ground up.
- Expert-Grade: Crafted with the meticulousness and usability expected by top financial executives.
- Intuitive: Simple to navigate, making it accessible for users without extensive financial modeling skills.
Who Can Benefit from Our Product?
- Institutional Investors: Develop comprehensive and accurate valuation models for portfolio management.
- Corporate Finance Departments: Evaluate valuation scenarios to inform strategic decision-making.
- Consultants and Financial Advisors: Offer clients precise valuation analyses for Genew Technologies Co.,Ltd. (688418SS).
- Students and Educators: Utilize real-world data to enhance financial modeling skills in academic settings.
- Technology Enthusiasts: Gain insights into the valuation dynamics of tech companies like Genew Technologies Co.,Ltd. (688418SS).
Contents of the Template
- Detailed DCF Model: An editable template featuring extensive valuation calculations.
- Current Market Data: Genew Technologies Co., Ltd.'s historical and forecasted financials preloaded for in-depth analysis.
- Adjustable Variables: Modify WACC, growth rates, and tax assumptions to explore different scenarios.
- Comprehensive Financial Statements: Complete annual and quarterly breakdowns for enhanced insights.
- Essential Ratios: Integrated analysis for evaluating profitability, efficiency, and leverage.
- Interactive Dashboard: Visual charts and tables to deliver clear, actionable insights.
Disclaimer
All information, articles, and product details provided on this website are for general informational and educational purposes only. We do not claim any ownership over, nor do we intend to infringe upon, any trademarks, copyrights, logos, brand names, or other intellectual property mentioned or depicted on this site. Such intellectual property remains the property of its respective owners, and any references here are made solely for identification or informational purposes, without implying any affiliation, endorsement, or partnership.
We make no representations or warranties, express or implied, regarding the accuracy, completeness, or suitability of any content or products presented. Nothing on this website should be construed as legal, tax, investment, financial, medical, or other professional advice. In addition, no part of this site—including articles or product references—constitutes a solicitation, recommendation, endorsement, advertisement, or offer to buy or sell any securities, franchises, or other financial instruments, particularly in jurisdictions where such activity would be unlawful.
All content is of a general nature and may not address the specific circumstances of any individual or entity. It is not a substitute for professional advice or services. Any actions you take based on the information provided here are strictly at your own risk. You accept full responsibility for any decisions or outcomes arising from your use of this website and agree to release us from any liability in connection with your use of, or reliance upon, the content or products found herein.