
|
Nanya New Material Technology Co., Ltd (688519.ss) Valoración de DCF |
Completamente Editable: Adáptelo A Sus Necesidades En Excel O Sheets
Diseño Profesional: Plantillas Confiables Y Estándares De La Industria
Predeterminadas Para Un Uso Rápido Y Eficiente
Compatible con MAC / PC, completamente desbloqueado
No Se Necesita Experiencia; Fáciles De Seguir
Nanya New Material Technology Co.,Ltd (688519.SS) Bundle
¡Mejore sus estrategias de inversión con Nanya New Material Technology Co., Ltd (688519SS) Calculadora DCF! Coloque en datos financieros auténticos, ajuste las predicciones y gastos de crecimiento, y observe instantáneamente cómo estas modificaciones afectan el valor intrínseco de Nanya New Material Technology Co., Ltd (688519SS).
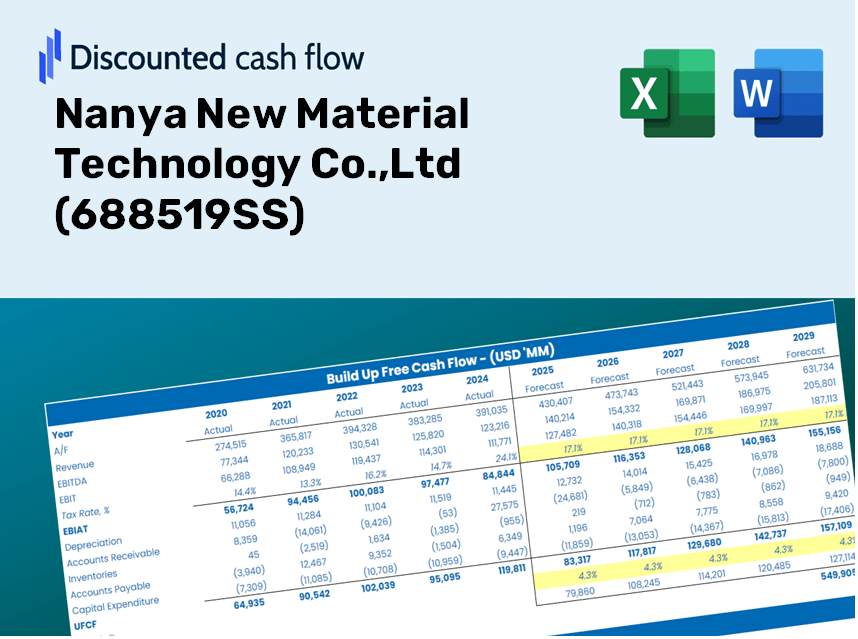
Discounted Cash Flow (DCF) - (USD MM)
| Year | AY1 2020 |
AY2 2021 |
AY3 2022 |
AY4 2023 |
AY5 2024 |
FY1 2025 |
FY2 2026 |
FY3 2027 |
FY4 2028 |
FY5 2029 |
|---|---|---|---|---|---|---|---|---|---|---|
| Revenue | 2,120.7 | 4,207.1 | 3,778.2 | 2,982.8 | 3,361.5 | 4,032.5 | 4,837.3 | 5,802.8 | 6,960.9 | 8,350.2 |
| Revenue Growth, % | 0 | 98.39 | -10.19 | -21.05 | 12.7 | 19.96 | 19.96 | 19.96 | 19.96 | 19.96 |
| EBITDA | 167.9 | 464.9 | 30.5 | -64.6 | 151.9 | 178.5 | 214.1 | 256.8 | 308.1 | 369.5 |
| EBITDA, % | 7.92 | 11.05 | 0.80744 | -2.17 | 4.52 | 4.43 | 4.43 | 4.43 | 4.43 | 4.43 |
| Depreciation | 51.5 | 64.9 | 86.0 | 115.6 | 127.8 | 112.3 | 134.7 | 161.6 | 193.9 | 232.6 |
| Depreciation, % | 2.43 | 1.54 | 2.27 | 3.88 | 3.8 | 2.79 | 2.79 | 2.79 | 2.79 | 2.79 |
| EBIT | 116.4 | 400.0 | -55.4 | -180.2 | 24.1 | 66.1 | 79.4 | 95.2 | 114.2 | 137.0 |
| EBIT, % | 5.49 | 9.51 | -1.47 | -6.04 | 0.71656 | 1.64 | 1.64 | 1.64 | 1.64 | 1.64 |
| Total Cash | 1,367.6 | 1,135.6 | 711.8 | 536.1 | 422.0 | 1,136.0 | 1,362.7 | 1,634.7 | 1,960.9 | 2,352.3 |
| Total Cash, percent | .0 | .0 | .0 | .0 | .0 | .0 | .0 | .0 | .0 | .0 |
| Account Receivables | 1,165.6 | 2,322.3 | 2,052.1 | 1,732.1 | 2,017.5 | 2,278.9 | 2,733.7 | 3,279.3 | 3,933.8 | 4,719.0 |
| Account Receivables, % | 54.97 | 55.2 | 54.31 | 58.07 | 60.02 | 56.51 | 56.51 | 56.51 | 56.51 | 56.51 |
| Inventories | 265.1 | 395.1 | 398.6 | 470.0 | 350.4 | 472.8 | 567.2 | 680.4 | 816.1 | 979.0 |
| Inventories, % | 12.5 | 9.39 | 10.55 | 15.76 | 10.42 | 11.72 | 11.72 | 11.72 | 11.72 | 11.72 |
| Accounts Payable | 505.3 | 1,132.4 | 997.9 | 845.7 | 1,291.8 | 1,160.8 | 1,392.5 | 1,670.5 | 2,003.9 | 2,403.8 |
| Accounts Payable, % | 23.83 | 26.92 | 26.41 | 28.35 | 38.43 | 28.79 | 28.79 | 28.79 | 28.79 | 28.79 |
| Capital Expenditure | -214.1 | -510.4 | -520.0 | -281.0 | -140.2 | -399.9 | -479.7 | -575.4 | -690.3 | -828.1 |
| Capital Expenditure, % | -10.1 | -12.13 | -13.76 | -9.42 | -4.17 | -9.92 | -9.92 | -9.92 | -9.92 | -9.92 |
| Tax Rate, % | -1.26 | -1.26 | -1.26 | -1.26 | -1.26 | -1.26 | -1.26 | -1.26 | -1.26 | -1.26 |
| EBITAT | 103.3 | 351.0 | -197.1 | -144.2 | 24.4 | 60.4 | 72.4 | 86.9 | 104.3 | 125.1 |
| Depreciation | ||||||||||
| Changes in Account Receivables | ||||||||||
| Changes in Inventories | ||||||||||
| Changes in Accounts Payable | ||||||||||
| Capital Expenditure | ||||||||||
| UFCF | -984.7 | -754.1 | -499.1 | -213.2 | 292.3 | -741.9 | -590.0 | -707.8 | -849.1 | -1,018.5 |
| WACC, % | 8.34 | 8.34 | 8.34 | 8.33 | 8.34 | 8.34 | 8.34 | 8.34 | 8.34 | 8.34 |
| PV UFCF | ||||||||||
| SUM PV UFCF | -3,042.9 | |||||||||
| Long Term Growth Rate, % | 3.50 | |||||||||
| Free cash flow (T + 1) | -1,054 | |||||||||
| Terminal Value | -21,789 | |||||||||
| Present Terminal Value | -14,599 | |||||||||
| Enterprise Value | -17,642 | |||||||||
| Net Debt | -188 | |||||||||
| Equity Value | -17,454 | |||||||||
| Diluted Shares Outstanding, MM | 229 | |||||||||
| Equity Value Per Share | -76.31 |
What You Will Receive
- Flexible Forecast Inputs: Effortlessly adjust variables (growth %, margins, WACC) to generate various scenarios.
- Accurate Financial Data: Nanya New Material Technology Co., Ltd's (688519SS) financials pre-loaded to kickstart your analysis.
- Automated DCF Calculations: The template computes Net Present Value (NPV) and intrinsic value automatically.
- Customizable and Professional Design: A refined Excel model tailored to meet your valuation requirements.
- Designed for Analysts and Investors: Perfect for evaluating projections, validating strategies, and optimizing efficiency.
Key Features
- 🔍 Real-Life Nanya Financials: Pre-filled historical and projected data for Nanya New Material Technology Co., Ltd (688519SS).
- ✏️ Fully Customizable Inputs: Adjust all critical parameters (yellow cells) such as WACC, growth %, and tax rates.
- 📊 Professional DCF Valuation: Built-in formulas calculate Nanya’s intrinsic value using the Discounted Cash Flow method.
- ⚡ Instant Results: Visualize Nanya’s valuation instantly after making adjustments.
- Scenario Analysis: Test and compare outcomes for various financial assumptions side-by-side.
How It Functions
- Download the Template: Gain immediate access to the Excel-based Nanya New Material Technology DCF Calculator.
- Input Your Assumptions: Modify the yellow-highlighted cells for growth rates, WACC, margins, and more.
- Instant Calculations: The model automatically recalculates the intrinsic value of Nanya New Material Technology.
- Test Scenarios: Experiment with various assumptions to assess potential valuation impacts.
- Analyze and Decide: Use the outcomes to inform your investment or financial evaluation.
Why Opt for This Calculator?
- User-Friendly Interface: Tailored for both novices and seasoned professionals.
- Customizable Inputs: Easily adjust parameters to suit your analysis needs.
- Real-Time Feedback: Observe immediate updates to Nanya's valuation as you modify the inputs.
- Pre-Loaded Data: Comes with Nanya's actual financial information for effortless analysis.
- Preferred by Experts: Trusted by investors and analysts for sound decision-making.
Who Can Benefit from Nanya New Material Technology Co., Ltd's Products?
- Investors: Enhance your investment choices with a reliable valuation tool specifically designed for industry analysis.
- Financial Analysts: Streamline your workflow with an easily customizable DCF model tailored for Nanya's market.
- Consultants: Efficiently modify our templates for impactful client presentations or detailed reports.
- Finance Enthusiasts: Expand your knowledge of valuation methods through practical, real-world applications related to Nanya's offerings.
- Educators and Students: Utilize this resource as a hands-on learning aid in financial studies focused on material technology.
Contents of the Template
- In-Depth DCF Model: Editable template featuring comprehensive valuation calculations.
- Current Financial Data: Nanya New Material Technology Co., Ltd's historical and projected financials preloaded for analysis.
- Adjustable Parameters: Modify WACC, growth rates, and tax assumptions to explore various scenarios.
- Detailed Financial Statements: Complete annual and quarterly financial breakdowns for enhanced insights.
- Essential Ratios: Integrated analysis for profitability, efficiency, and leverage metrics.
- Visual Dashboard: Graphs and tables to provide clear, actionable insights.
Disclaimer
All information, articles, and product details provided on this website are for general informational and educational purposes only. We do not claim any ownership over, nor do we intend to infringe upon, any trademarks, copyrights, logos, brand names, or other intellectual property mentioned or depicted on this site. Such intellectual property remains the property of its respective owners, and any references here are made solely for identification or informational purposes, without implying any affiliation, endorsement, or partnership.
We make no representations or warranties, express or implied, regarding the accuracy, completeness, or suitability of any content or products presented. Nothing on this website should be construed as legal, tax, investment, financial, medical, or other professional advice. In addition, no part of this site—including articles or product references—constitutes a solicitation, recommendation, endorsement, advertisement, or offer to buy or sell any securities, franchises, or other financial instruments, particularly in jurisdictions where such activity would be unlawful.
All content is of a general nature and may not address the specific circumstances of any individual or entity. It is not a substitute for professional advice or services. Any actions you take based on the information provided here are strictly at your own risk. You accept full responsibility for any decisions or outcomes arising from your use of this website and agree to release us from any liability in connection with your use of, or reliance upon, the content or products found herein.