
|
Verisilicon Microelectronics Co., Ltd. (688521.ss) Valoración de DCF |
Completamente Editable: Adáptelo A Sus Necesidades En Excel O Sheets
Diseño Profesional: Plantillas Confiables Y Estándares De La Industria
Predeterminadas Para Un Uso Rápido Y Eficiente
Compatible con MAC / PC, completamente desbloqueado
No Se Necesita Experiencia; Fáciles De Seguir
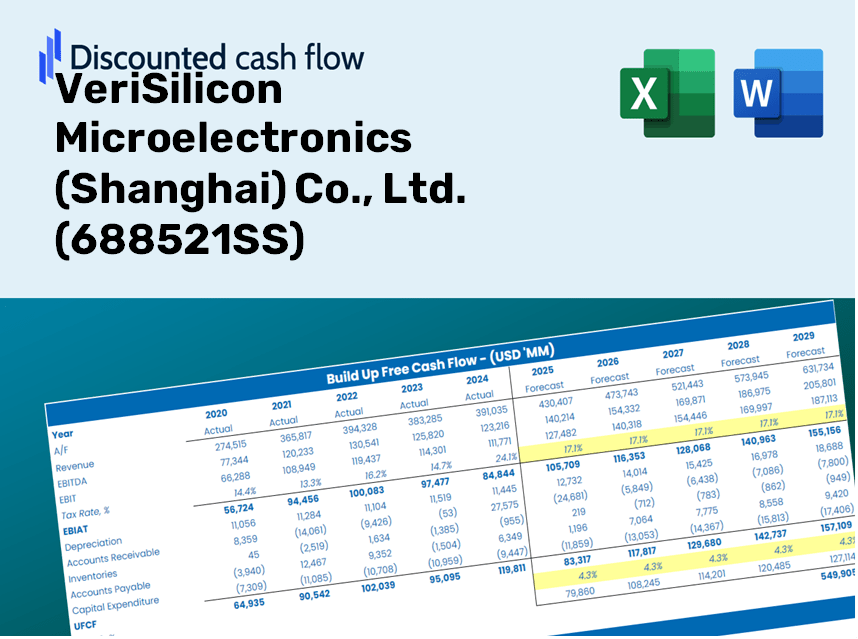
VeriSilicon Microelectronics (Shanghai) Co., Ltd. (688521.SS) Bundle
Como inversor o analista, esta calculadora DCF [símbolo] es la herramienta perfecta para una valoración precisa. Equipados con datos reales de VeriSilicon Microelectronics (Shanghai) Co., Ltd., puede ajustar los pronósticos e observar inmediatamente los efectos.
Discounted Cash Flow (DCF) - (USD MM)
| Year | AY1 2020 |
AY2 2021 |
AY3 2022 |
AY4 2023 |
AY5 2024 |
FY1 2025 |
FY2 2026 |
FY3 2027 |
FY4 2028 |
FY5 2029 |
|---|---|---|---|---|---|---|---|---|---|---|
| Revenue | 1,506.1 | 2,139.3 | 2,679.0 | 2,338.0 | 2,321.9 | 2,634.5 | 2,989.1 | 3,391.5 | 3,848.1 | 4,366.2 |
| Revenue Growth, % | 0 | 42.04 | 25.23 | -12.73 | -0.68909 | 13.46 | 13.46 | 13.46 | 13.46 | 13.46 |
| EBITDA | 36.9 | 92.2 | 136.2 | -117.6 | -538.1 | -86.2 | -97.8 | -111.0 | -126.0 | -142.9 |
| EBITDA, % | 2.45 | 4.31 | 5.08 | -5.03 | -23.18 | -3.27 | -3.27 | -3.27 | -3.27 | -3.27 |
| Depreciation | 80.7 | 86.5 | 119.1 | 143.6 | 66.2 | 120.4 | 136.6 | 154.9 | 175.8 | 199.5 |
| Depreciation, % | 5.36 | 4.05 | 4.45 | 6.14 | 2.85 | 4.57 | 4.57 | 4.57 | 4.57 | 4.57 |
| EBIT | -43.8 | 5.6 | 17.1 | -261.2 | -604.3 | -206.6 | -234.4 | -266.0 | -301.8 | -342.4 |
| EBIT, % | -2.91 | 0.26281 | 0.63967 | -11.17 | -26.03 | -7.84 | -7.84 | -7.84 | -7.84 | -7.84 |
| Total Cash | 1,897.6 | 1,804.7 | 865.8 | 1,088.9 | 859.2 | 1,582.0 | 1,795.0 | 2,036.6 | 2,310.8 | 2,621.9 |
| Total Cash, percent | .0 | .0 | .0 | .0 | .0 | .0 | .0 | .0 | .0 | .0 |
| Account Receivables | 555.9 | 874.4 | 1,229.1 | 1,185.1 | 1,210.2 | 1,193.2 | 1,353.9 | 1,536.1 | 1,743.0 | 1,977.6 |
| Account Receivables, % | 36.91 | 40.87 | 45.88 | 50.69 | 52.12 | 45.29 | 45.29 | 45.29 | 45.29 | 45.29 |
| Inventories | 83.5 | 133.4 | 422.5 | 278.6 | 395.5 | 297.7 | 337.8 | 383.3 | 434.9 | 493.4 |
| Inventories, % | 5.54 | 6.24 | 15.77 | 11.92 | 17.03 | 11.3 | 11.3 | 11.3 | 11.3 | 11.3 |
| Accounts Payable | 136.6 | 231.3 | 214.1 | 96.1 | 163.2 | 205.5 | 233.2 | 264.6 | 300.2 | 340.6 |
| Accounts Payable, % | 9.07 | 10.81 | 7.99 | 4.11 | 7.03 | 7.8 | 7.8 | 7.8 | 7.8 | 7.8 |
| Capital Expenditure | -141.3 | -136.0 | -843.6 | -115.4 | -143.6 | -307.5 | -348.9 | -395.8 | -449.1 | -509.6 |
| Capital Expenditure, % | -9.38 | -6.36 | -31.49 | -4.94 | -6.19 | -11.67 | -11.67 | -11.67 | -11.67 | -11.67 |
| Tax Rate, % | -3.26 | -3.26 | -3.26 | -3.26 | -3.26 | -3.26 | -3.26 | -3.26 | -3.26 | -3.26 |
| EBITAT | -136.2 | 3.1 | 13.5 | -287.7 | -624.0 | -179.2 | -203.4 | -230.7 | -261.8 | -297.0 |
| Depreciation | ||||||||||
| Changes in Account Receivables | ||||||||||
| Changes in Inventories | ||||||||||
| Changes in Accounts Payable | ||||||||||
| Capital Expenditure | ||||||||||
| UFCF | -699.5 | -320.2 | -1,372.1 | -189.5 | -776.4 | -209.2 | -588.7 | -668.0 | -757.9 | -859.9 |
| WACC, % | 5.84 | 5.82 | 5.83 | 5.84 | 5.84 | 5.83 | 5.83 | 5.83 | 5.83 | 5.83 |
| PV UFCF | ||||||||||
| SUM PV UFCF | -2,538.5 | |||||||||
| Long Term Growth Rate, % | 2.00 | |||||||||
| Free cash flow (T + 1) | -877 | |||||||||
| Terminal Value | -22,875 | |||||||||
| Present Terminal Value | -17,228 | |||||||||
| Enterprise Value | -19,766 | |||||||||
| Net Debt | 130 | |||||||||
| Equity Value | -19,896 | |||||||||
| Diluted Shares Outstanding, MM | 500 | |||||||||
| Equity Value Per Share | -39.76 |
Benefits You Will Receive
- Pre-Filled Financial Model: Leverage VeriSilicon's actual data for accurate DCF valuation.
- Comprehensive Forecast Control: Modify revenue growth, profit margins, WACC, and other essential metrics.
- Real-Time Calculations: Automatic updates provide immediate results as you adjust inputs.
- Professional-Grade Template: A polished Excel file crafted for high-quality valuation analysis.
- Flexible and Reusable: Designed for adaptability, allowing for consistent use across various forecasts.
Key Features
- 🔍 Real-Life [688521SS] Financials: Pre-filled historical and projected data for VeriSilicon Microelectronics (Shanghai) Co., Ltd.
- ✏️ Fully Customizable Inputs: Modify all essential parameters (yellow cells) such as WACC, growth %, and tax rates.
- 📊 Professional DCF Valuation: Integrated formulas compute VeriSilicon’s intrinsic value using the Discounted Cash Flow approach.
- ⚡ Instant Results: View VeriSilicon’s valuation in real-time after adjusting inputs.
- Scenario Analysis: Assess and contrast outcomes based on different financial assumptions side-by-side.
How It Works
- 1. Access the Template: Download and open the Excel file featuring VeriSilicon Microelectronics (Shanghai) Co., Ltd. (688521SS) preloaded data.
- 2. Modify Assumptions: Update key inputs such as growth rates, WACC, and capital expenditures.
- 3. See Results in Real-Time: The DCF model automatically calculates the intrinsic value and NPV.
- 4. Explore Scenarios: Compare various forecasts to evaluate different valuation scenarios.
- 5. Present with Confidence: Share professional valuation insights to bolster your decision-making.
Why Choose VeriSilicon's Calculator?
- Save Time: Get started immediately with a pre-built DCF model—no setup required.
- Enhance Accuracy: Utilize dependable financial data and formulas to minimize valuation errors.
- Fully Customizable: Adjust the model to match your specific assumptions and forecasts.
- User-Friendly: Intuitive charts and outputs simplify result analysis.
- Endorsed by Industry Professionals: Crafted for experts who prioritize precision and ease of use.
Who Can Benefit from This Product?
- Microelectronics Students: Understand advanced semiconductor concepts and apply them to real-world scenarios.
- Researchers: Utilize cutting-edge models for your academic studies and publications.
- Investors: Validate your projections and assess the performance metrics of VeriSilicon Microelectronics (688521SS).
- Industry Analysts: Optimize your research process with an intuitive, customizable financial model.
- Startup Founders: Discover how established companies like VeriSilicon are evaluated in the microelectronics sector.
Contents of the Template
- Pre-Filled Data: Features VeriSilicon’s historical financial performance and future projections.
- Discounted Cash Flow Model: Editable DCF valuation model with automated calculations.
- Weighted Average Cost of Capital (WACC): A dedicated worksheet for calculating WACC using tailored inputs.
- Key Financial Ratios: Assess VeriSilicon’s profitability, operational efficiency, and financial leverage.
- Customizable Inputs: Easily adjust revenue growth, profit margins, and tax rates.
- Clear Dashboard: Visual representations and tables summarizing critical valuation outcomes.
Disclaimer
All information, articles, and product details provided on this website are for general informational and educational purposes only. We do not claim any ownership over, nor do we intend to infringe upon, any trademarks, copyrights, logos, brand names, or other intellectual property mentioned or depicted on this site. Such intellectual property remains the property of its respective owners, and any references here are made solely for identification or informational purposes, without implying any affiliation, endorsement, or partnership.
We make no representations or warranties, express or implied, regarding the accuracy, completeness, or suitability of any content or products presented. Nothing on this website should be construed as legal, tax, investment, financial, medical, or other professional advice. In addition, no part of this site—including articles or product references—constitutes a solicitation, recommendation, endorsement, advertisement, or offer to buy or sell any securities, franchises, or other financial instruments, particularly in jurisdictions where such activity would be unlawful.
All content is of a general nature and may not address the specific circumstances of any individual or entity. It is not a substitute for professional advice or services. Any actions you take based on the information provided here are strictly at your own risk. You accept full responsibility for any decisions or outcomes arising from your use of this website and agree to release us from any liability in connection with your use of, or reliance upon, the content or products found herein.