
|
KBC Corporation, Ltd. (688598.ss) Valoración de DCF |
Completamente Editable: Adáptelo A Sus Necesidades En Excel O Sheets
Diseño Profesional: Plantillas Confiables Y Estándares De La Industria
Predeterminadas Para Un Uso Rápido Y Eficiente
Compatible con MAC / PC, completamente desbloqueado
No Se Necesita Experiencia; Fáciles De Seguir
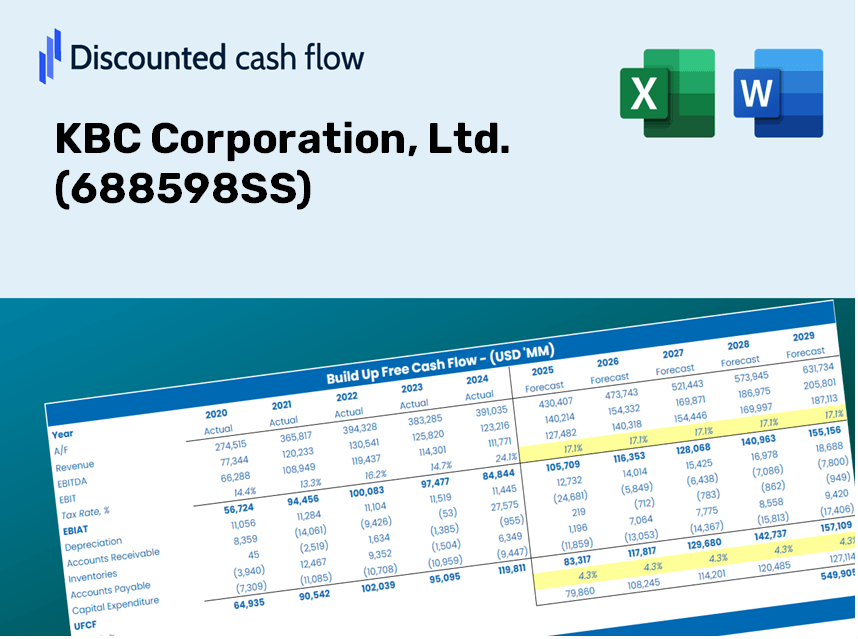
KBC Corporation, Ltd. (688598.SS) Bundle
Ya sea que sea un inversor o analista, esta calculadora DCF (688598SS) es su recurso de referencia para una valoración precisa. Equipado con datos reales de KBC Corporation, Ltd., puede ajustar los pronósticos y observar instantáneamente los efectos.
Discounted Cash Flow (DCF) - (USD MM)
| Year | AY1 2020 |
AY2 2021 |
AY3 2022 |
AY4 2023 |
AY5 2024 |
FY1 2025 |
FY2 2026 |
FY3 2027 |
FY4 2028 |
FY5 2029 |
|---|---|---|---|---|---|---|---|---|---|---|
| Revenue | 426.5 | 1,337.9 | 1,450.1 | 1,071.5 | 536.9 | 580.3 | 627.3 | 678.1 | 733.0 | 792.4 |
| Revenue Growth, % | 0 | 213.72 | 8.39 | -26.11 | -49.9 | 8.1 | 8.1 | 8.1 | 8.1 | 8.1 |
| EBITDA | 187.6 | 598.9 | 409.4 | 97.6 | -219.0 | 99.0 | 107.0 | 115.7 | 125.1 | 135.2 |
| EBITDA, % | 44 | 44.76 | 28.23 | 9.11 | -40.8 | 17.06 | 17.06 | 17.06 | 17.06 | 17.06 |
| Depreciation | 15.0 | 56.0 | 71.2 | 114.9 | 188.3 | 67.8 | 73.3 | 79.2 | 85.6 | 92.5 |
| Depreciation, % | 3.51 | 4.18 | 4.91 | 10.72 | 35.07 | 11.68 | 11.68 | 11.68 | 11.68 | 11.68 |
| EBIT | 172.7 | 542.9 | 338.2 | -17.3 | -407.3 | 31.2 | 33.8 | 36.5 | 39.4 | 42.6 |
| EBIT, % | 40.49 | 40.58 | 23.32 | -1.62 | -75.86 | 5.38 | 5.38 | 5.38 | 5.38 | 5.38 |
| Total Cash | 721.3 | 882.7 | 3,077.8 | 2,195.7 | 1,482.5 | 540.8 | 584.6 | 632.0 | 683.1 | 738.4 |
| Total Cash, percent | .0 | .0 | .0 | .0 | .0 | .0 | .0 | .0 | .0 | .0 |
| Account Receivables | 310.4 | 689.6 | 773.4 | 843.3 | 514.3 | 408.7 | 441.8 | 477.6 | 516.3 | 558.1 |
| Account Receivables, % | 72.79 | 51.54 | 53.33 | 78.7 | 95.8 | 70.43 | 70.43 | 70.43 | 70.43 | 70.43 |
| Inventories | 47.3 | 270.0 | 190.7 | 251.2 | 300.4 | 143.7 | 155.4 | 167.9 | 181.5 | 196.2 |
| Inventories, % | 11.09 | 20.18 | 13.15 | 23.44 | 55.96 | 24.76 | 24.76 | 24.76 | 24.76 | 24.76 |
| Accounts Payable | 39.2 | 163.4 | 202.8 | 534.8 | 559.0 | 215.1 | 232.5 | 251.3 | 271.7 | 293.6 |
| Accounts Payable, % | 9.19 | 12.22 | 13.99 | 49.91 | 104.11 | 37.06 | 37.06 | 37.06 | 37.06 | 37.06 |
| Capital Expenditure | -225.3 | -640.5 | -1,204.4 | -1,306.4 | -798.0 | -445.4 | -481.5 | -520.5 | -562.6 | -608.2 |
| Capital Expenditure, % | -52.84 | -47.88 | -83.06 | -121.92 | -148.64 | -76.75 | -76.75 | -76.75 | -76.75 | -76.75 |
| Tax Rate, % | 2.43 | 2.43 | 2.43 | 2.43 | 2.43 | 2.43 | 2.43 | 2.43 | 2.43 | 2.43 |
| EBITAT | 147.2 | 473.4 | 300.9 | -15.5 | -397.4 | 28.0 | 30.3 | 32.7 | 35.4 | 38.2 |
| Depreciation | ||||||||||
| Changes in Account Receivables | ||||||||||
| Changes in Inventories | ||||||||||
| Changes in Accounts Payable | ||||||||||
| Capital Expenditure | ||||||||||
| UFCF | -381.7 | -588.6 | -797.5 | -1,005.4 | -703.3 | -431.2 | -405.3 | -438.1 | -473.5 | -511.9 |
| WACC, % | 14.59 | 14.6 | 14.6 | 14.6 | 14.62 | 14.6 | 14.6 | 14.6 | 14.6 | 14.6 |
| PV UFCF | ||||||||||
| SUM PV UFCF | -1,509.3 | |||||||||
| Long Term Growth Rate, % | 3.50 | |||||||||
| Free cash flow (T + 1) | -530 | |||||||||
| Terminal Value | -4,771 | |||||||||
| Present Terminal Value | -2,413 | |||||||||
| Enterprise Value | -3,923 | |||||||||
| Net Debt | 93 | |||||||||
| Equity Value | -4,016 | |||||||||
| Diluted Shares Outstanding, MM | 205 | |||||||||
| Equity Value Per Share | -19.62 |
What You Will Receive
- Accurate KBC Financial Data: Pre-filled with KBC Corporation’s historical and forecasted figures for in-depth analysis.
- Customizable Template: Easily adjust core inputs such as revenue growth, WACC, and EBITDA percentage.
- Instant Calculations: Observe real-time updates to KBC’s intrinsic value as you make alterations.
- Expert Valuation Tool: Tailored for investors, analysts, and consultants who require precise DCF evaluations.
- Intuitive Layout: Designed with a straightforward structure and easy-to-follow instructions for users of all skill levels.
Key Features
- Pre-Loaded Data: KBC Corporation’s historical financial statements and pre-filled forecasts.
- Fully Adjustable Inputs: Customize WACC, tax rates, revenue growth, and EBITDA margins.
- Instant Results: View KBC Corporation's intrinsic value recalculating in real-time.
- Clear Visual Outputs: Dashboard charts illustrate valuation results and key metrics.
- Built for Accuracy: A professional tool designed for analysts, investors, and finance experts.
How It Operates
- Download: Obtain the pre-configured Excel file featuring KBC Corporation, Ltd.'s (688598SS) financial data.
- Customize: Modify forecasts such as revenue growth, EBITDA margin, and WACC.
- Update Automatically: The intrinsic value and NPV calculations refresh in real-time.
- Test Scenarios: Generate various projections and instantly compare the results.
- Make Decisions: Leverage the valuation insights to inform your investment strategy.
Why Choose KBC Corporation's Calculator?
- Designed for Experts: A sophisticated tool trusted by financial analysts, CFOs, and consultants.
- Comprehensive Data: KBC’s historical and projected financials are preloaded for enhanced accuracy.
- Flexible Scenario Analysis: Easily simulate various forecasts and assumptions.
- Clear Outputs: Automatically computes intrinsic value, NPV, and other essential metrics.
- User-Friendly: Detailed step-by-step instructions help you navigate the process effortlessly.
Who Can Benefit from KBC Corporation, Ltd. (688598SS)?
- Institutional Investors: Develop sophisticated valuation models to enhance portfolio evaluations.
- Corporate Finance Departments: Assess various valuation scenarios to inform strategic decisions.
- Financial Consultants and Advisors: Deliver precise valuation analyses for KBC Corporation, Ltd. stock.
- Students and Academics: Utilize real-world data to learn and teach financial modeling techniques.
- Market Analysts: Explore how companies like KBC Corporation, Ltd. are appraised within the financial landscape.
Contents of the Template
- Preloaded KBC Data: Historical and forecasted financial information, encompassing revenue, EBIT, and capital expenditures.
- DCF and WACC Models: High-quality sheets designed for calculating intrinsic value and Weighted Average Cost of Capital.
- Editable Inputs: Yellow-highlighted cells for modifying revenue growth, tax rates, and discount rates.
- Financial Statements: Detailed annual and quarterly financial reports for in-depth analysis.
- Key Ratios: Measures of profitability, leverage, and efficiency for assessing performance.
- Dashboard and Charts: Visual representations of valuation results and underlying assumptions.
Disclaimer
All information, articles, and product details provided on this website are for general informational and educational purposes only. We do not claim any ownership over, nor do we intend to infringe upon, any trademarks, copyrights, logos, brand names, or other intellectual property mentioned or depicted on this site. Such intellectual property remains the property of its respective owners, and any references here are made solely for identification or informational purposes, without implying any affiliation, endorsement, or partnership.
We make no representations or warranties, express or implied, regarding the accuracy, completeness, or suitability of any content or products presented. Nothing on this website should be construed as legal, tax, investment, financial, medical, or other professional advice. In addition, no part of this site—including articles or product references—constitutes a solicitation, recommendation, endorsement, advertisement, or offer to buy or sell any securities, franchises, or other financial instruments, particularly in jurisdictions where such activity would be unlawful.
All content is of a general nature and may not address the specific circumstances of any individual or entity. It is not a substitute for professional advice or services. Any actions you take based on the information provided here are strictly at your own risk. You accept full responsibility for any decisions or outcomes arising from your use of this website and agree to release us from any liability in connection with your use of, or reliance upon, the content or products found herein.