
|
Wuxi Etek Microelectronics Co., Ltd. (688601.ss) Valoración de DCF |
Completamente Editable: Adáptelo A Sus Necesidades En Excel O Sheets
Diseño Profesional: Plantillas Confiables Y Estándares De La Industria
Predeterminadas Para Un Uso Rápido Y Eficiente
Compatible con MAC / PC, completamente desbloqueado
No Se Necesita Experiencia; Fáciles De Seguir
Wuxi ETEK Microelectronics Co.,Ltd. (688601.SS) Bundle
¡Simplifique Wuxi Etek Microelectronics Co., Ltd. Valoración con esta calculadora DCF personalizable! Con el Real Wuxi Etek Microelectronics Co., Ltd. Financials y las entradas de pronóstico ajustables, puede probar escenarios y descubrir Wuxi Etek Microelectronics Co., Ltd. Valor razonable en minutos.
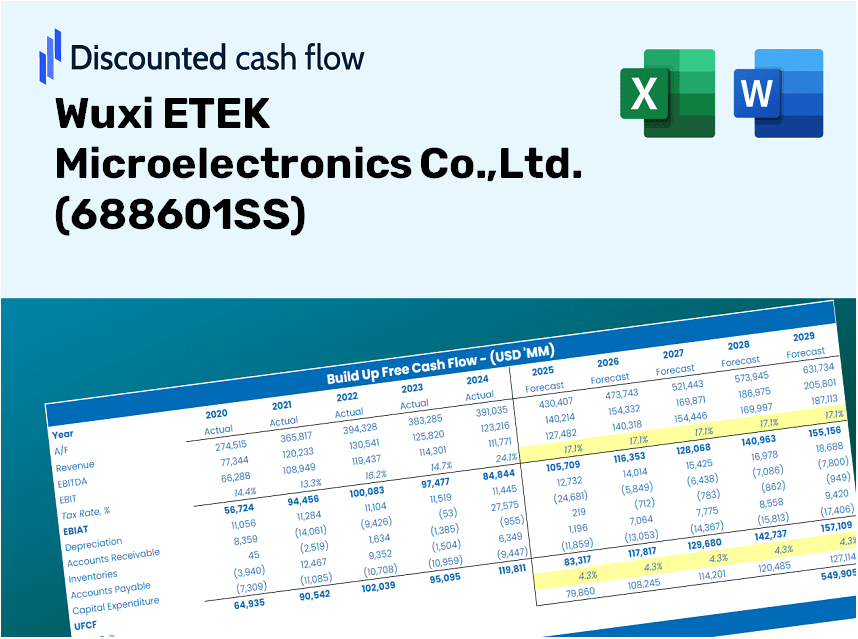
Discounted Cash Flow (DCF) - (USD MM)
| Year | AY1 2020 |
AY2 2021 |
AY3 2022 |
AY4 2023 |
AY5 2024 |
FY1 2025 |
FY2 2026 |
FY3 2027 |
FY4 2028 |
FY5 2029 |
|---|---|---|---|---|---|---|---|---|---|---|
| Revenue | 542.8 | 773.6 | 767.5 | 886.8 | 787.5 | 878.2 | 979.3 | 1,092.1 | 1,217.9 | 1,358.1 |
| Revenue Growth, % | 0 | 42.5 | -0.78176 | 15.54 | -11.19 | 11.52 | 11.52 | 11.52 | 11.52 | 11.52 |
| EBITDA | 75.0 | 181.0 | 171.5 | 230.9 | 143.2 | 182.3 | 203.3 | 226.7 | 252.8 | 281.9 |
| EBITDA, % | 13.81 | 23.4 | 22.34 | 26.04 | 18.19 | 20.75 | 20.75 | 20.75 | 20.75 | 20.75 |
| Depreciation | 4.6 | 7.8 | 11.5 | 12.3 | 13.1 | 11.3 | 12.6 | 14.0 | 15.6 | 17.4 |
| Depreciation, % | 0.85159 | 1.01 | 1.5 | 1.39 | 1.66 | 1.28 | 1.28 | 1.28 | 1.28 | 1.28 |
| EBIT | 70.4 | 173.2 | 159.9 | 218.5 | 130.2 | 171.0 | 190.7 | 212.7 | 237.2 | 264.5 |
| EBIT, % | 12.96 | 22.39 | 20.84 | 24.65 | 16.53 | 19.47 | 19.47 | 19.47 | 19.47 | 19.47 |
| Total Cash | 164.7 | 703.5 | 816.0 | 967.0 | 819.9 | 739.9 | 825.1 | 920.2 | 1,026.1 | 1,144.3 |
| Total Cash, percent | .0 | .0 | .0 | .0 | .0 | .0 | .0 | .0 | .0 | .0 |
| Account Receivables | 127.3 | 209.3 | .0 | 224.9 | 223.2 | 183.0 | 204.1 | 227.6 | 253.8 | 283.1 |
| Account Receivables, % | 23.44 | 27.06 | 0 | 25.36 | 28.35 | 20.84 | 20.84 | 20.84 | 20.84 | 20.84 |
| Inventories | 91.5 | 128.0 | 179.2 | 182.2 | 146.7 | 168.5 | 187.9 | 209.5 | 233.7 | 260.6 |
| Inventories, % | 16.86 | 16.55 | 23.35 | 20.55 | 18.63 | 19.19 | 19.19 | 19.19 | 19.19 | 19.19 |
| Accounts Payable | 81.4 | 106.7 | 41.1 | 92.9 | 31.2 | 85.3 | 95.1 | 106.1 | 118.3 | 132.0 |
| Accounts Payable, % | 14.99 | 13.79 | 5.36 | 10.48 | 3.96 | 9.72 | 9.72 | 9.72 | 9.72 | 9.72 |
| Capital Expenditure | -7.2 | -12.4 | -9.4 | -18.9 | -16.1 | -14.6 | -16.3 | -18.2 | -20.3 | -22.6 |
| Capital Expenditure, % | -1.32 | -1.6 | -1.22 | -2.13 | -2.05 | -1.66 | -1.66 | -1.66 | -1.66 | -1.66 |
| Tax Rate, % | 2.98 | 2.98 | 2.98 | 2.98 | 2.98 | 2.98 | 2.98 | 2.98 | 2.98 | 2.98 |
| EBITAT | 67.1 | 159.5 | 146.3 | 201.4 | 126.3 | 160.1 | 178.5 | 199.1 | 222.0 | 247.6 |
| Depreciation | ||||||||||
| Changes in Account Receivables | ||||||||||
| Changes in Inventories | ||||||||||
| Changes in Accounts Payable | ||||||||||
| Capital Expenditure | ||||||||||
| UFCF | -72.8 | 61.7 | 241.0 | 18.7 | 98.7 | 229.3 | 144.1 | 160.7 | 179.2 | 199.9 |
| WACC, % | 5.54 | 5.54 | 5.54 | 5.54 | 5.54 | 5.54 | 5.54 | 5.54 | 5.54 | 5.54 |
| PV UFCF | ||||||||||
| SUM PV UFCF | 780.6 | |||||||||
| Long Term Growth Rate, % | 3.50 | |||||||||
| Free cash flow (T + 1) | 207 | |||||||||
| Terminal Value | 10,160 | |||||||||
| Present Terminal Value | 7,761 | |||||||||
| Enterprise Value | 8,541 | |||||||||
| Net Debt | -398 | |||||||||
| Equity Value | 8,940 | |||||||||
| Diluted Shares Outstanding, MM | 133 | |||||||||
| Equity Value Per Share | 67.34 |
Benefits You Will Receive
- Comprehensive Financial Model: Leverage Wuxi ETEK's actual data for accurate DCF valuation.
- Enhanced Forecast Control: Modify revenue growth, profit margins, WACC, and other essential factors.
- Real-Time Calculations: Instant updates provide immediate feedback as you make adjustments.
- Professional-Grade Template: A polished Excel file tailored for high-quality valuation.
- Flexibly Customizable: Designed for adaptability, ideal for repeated use in detailed forecasting.
Key Features
- 🔍 Real-Life Wuxi ETEK Financials: Pre-filled historical and projected data for Wuxi ETEK Microelectronics Co., Ltd. (688601SS).
- ✏️ Fully Customizable Inputs: Adjust all critical parameters (yellow cells) such as WACC, growth %, and tax rates.
- 📊 Professional DCF Valuation: Built-in formulas calculate Wuxi ETEK's intrinsic value using the Discounted Cash Flow method.
- ⚡ Instant Results: Visualize Wuxi ETEK's valuation immediately after making adjustments.
- Scenario Analysis: Test and compare outcomes for different financial assumptions side-by-side.
How It Works
- Step 1: Download the Excel file.
- Step 2: Review the pre-filled data for Wuxi ETEK Microelectronics Co., Ltd. (688601SS), including historical and projected figures.
- Step 3: Modify key assumptions (yellow cells) according to your analysis.
- Step 4: Observe the automatic recalculations for Wuxi ETEK's intrinsic value.
- Step 5: Utilize the outputs for your investment decisions or reporting needs.
Why Choose the Wuxi ETEK Microelectronics Co., Ltd. Calculator?
- User-Friendly Interface: Tailored for both novices and seasoned professionals.
- Customizable Parameters: Effortlessly adjust inputs to align with your analysis needs.
- Real-Time Insights: Instantly view changes in Wuxi ETEK's valuation as you modify inputs.
- Pre-Configured Data: Comes with Wuxi ETEK's actual financial metrics for swift evaluations.
- Relied Upon by Experts: A preferred tool for investors and analysts making strategic decisions.
Who Can Benefit from This Product?
- Investors: Assess the valuation of Wuxi ETEK Microelectronics Co., Ltd. (688601SS) before making investment decisions.
- CFOs and Financial Analysts: Optimize valuation methodologies and evaluate financial forecasts.
- Startup Founders: Gain insights into how significant tech firms like Wuxi ETEK are valued in the market.
- Consultants: Produce comprehensive valuation reports tailored for client needs.
- Students and Educators: Utilize current market data to practice and impart valuation skills and concepts.
Contents of the Template
- Operating and Balance Sheet Data: Pre-populated historical data and forecasts for Wuxi ETEK Microelectronics Co., Ltd. (688601SS), including revenue, EBITDA, EBIT, and capital expenditures.
- WACC Calculation: A dedicated sheet for calculating Weighted Average Cost of Capital (WACC), featuring parameters such as Beta, risk-free rate, and share price.
- DCF Valuation (Unlevered and Levered): Customizable Discounted Cash Flow models that detail intrinsic value through comprehensive calculations.
- Financial Statements: Pre-loaded annual and quarterly financial statements for thorough analysis.
- Key Ratios: Displays profitability, leverage, and efficiency ratios specific to Wuxi ETEK Microelectronics Co., Ltd. (688601SS).
- Dashboard and Charts: Visual representations of valuation outputs and underlying assumptions for straightforward analysis of results.
Disclaimer
All information, articles, and product details provided on this website are for general informational and educational purposes only. We do not claim any ownership over, nor do we intend to infringe upon, any trademarks, copyrights, logos, brand names, or other intellectual property mentioned or depicted on this site. Such intellectual property remains the property of its respective owners, and any references here are made solely for identification or informational purposes, without implying any affiliation, endorsement, or partnership.
We make no representations or warranties, express or implied, regarding the accuracy, completeness, or suitability of any content or products presented. Nothing on this website should be construed as legal, tax, investment, financial, medical, or other professional advice. In addition, no part of this site—including articles or product references—constitutes a solicitation, recommendation, endorsement, advertisement, or offer to buy or sell any securities, franchises, or other financial instruments, particularly in jurisdictions where such activity would be unlawful.
All content is of a general nature and may not address the specific circumstances of any individual or entity. It is not a substitute for professional advice or services. Any actions you take based on the information provided here are strictly at your own risk. You accept full responsibility for any decisions or outcomes arising from your use of this website and agree to release us from any liability in connection with your use of, or reliance upon, the content or products found herein.