
|
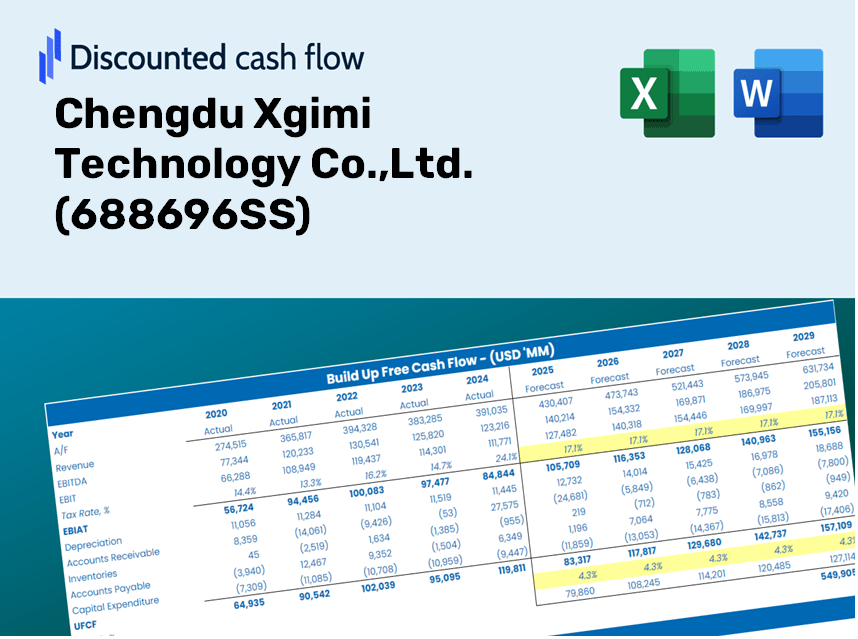
Chengdu Xgimi Technology Co., Ltd. (688696.ss) Valoración de DCF |
Completamente Editable: Adáptelo A Sus Necesidades En Excel O Sheets
Diseño Profesional: Plantillas Confiables Y Estándares De La Industria
Predeterminadas Para Un Uso Rápido Y Eficiente
Compatible con MAC / PC, completamente desbloqueado
No Se Necesita Experiencia; Fáciles De Seguir
Chengdu Xgimi Technology Co.,Ltd. (688696.SS) Bundle
Explore las perspectivas financieras de Chengdu Xgimi Technology Co., Ltd. (688696SS) ¡Con nuestra calculadora DCF fácil de usar! Ingrese sus suposiciones con respecto al crecimiento, los márgenes y los gastos para calcular el valor intrínseco de Chengdu Xgimi Technology Co., Ltd. (688696SS) y refine su enfoque de inversión.
Benefits You Will Receive
- Pre-Filled Financial Model: Utilize Xgimi's real data for accurate DCF valuation.
- Comprehensive Forecast Control: Modify revenue growth, profit margins, WACC, and other essential metrics.
- Real-Time Calculations: Enjoy automatic updates that display results as you adjust inputs.
- Professional-Grade Template: A polished Excel sheet crafted for high-quality valuation.
- Customizable and Reusable: Designed for adaptability, making it easy to generate detailed forecasts repeatedly.
Key Features
- Pre-Loaded Data: Historical financial statements and forecasts for Chengdu Xgimi Technology Co., Ltd. (688696SS).
- Fully Customizable Inputs: Adjust WACC, tax rates, revenue growth, and EBITDA margins as needed.
- Real-Time Calculations: View the intrinsic value of Chengdu Xgimi Technology Co., Ltd. (688696SS) update instantly.
- Intuitive Visual Outputs: Dashboard charts present valuation results and essential metrics clearly.
- Designed for Precision: A reliable tool tailored for analysts, investors, and finance professionals.
How It Works
- Step 1: Download the Excel file.
- Step 2: Review Chengdu Xgimi Technology Co., Ltd.'s pre-filled financial data and forecasts.
- Step 3: Modify key inputs such as revenue growth, WACC, and tax rates (highlighted cells).
- Step 4: Observe the DCF model update in real-time as you adjust your assumptions.
- Step 5: Evaluate the outputs and utilize the findings for your investment strategies.
Why Choose Our Financial Calculator for Chengdu Xgimi Technology Co., Ltd. (688696SS)?
- Designed for Experts: A sophisticated tool tailored for analysts, CFOs, and industry consultants.
- Comprehensive Data: Preloaded with Chengdu Xgimi's historical and projected financial data for precise analysis.
- Versatile Scenario Analysis: Effortlessly test various forecasts and assumptions.
- Detailed Outputs: Automatically computes intrinsic value, NPV, and essential financial metrics.
- User-Friendly: Step-by-step guidance helps you navigate the calculations with ease.
Who Can Benefit from This Product?
- Investors: Assess Chengdu Xgimi Technology Co., Ltd.'s (688696SS) valuation prior to making investment decisions.
- CFOs and Financial Analysts: Optimize valuation methodologies and validate financial forecasts.
- Startup Founders: Gain insights into how established companies like Chengdu Xgimi Technology are valued.
- Consultants: Provide comprehensive valuation analyses and reports for your clients.
- Students and Educators: Engage with real-world data to develop and teach valuation skills.
What the Template Includes
- Pre-Filled DCF Model: Chengdu Xgimi Technology Co., Ltd.'s financial data ready for immediate application.
- WACC Calculator: Comprehensive calculations for Weighted Average Cost of Capital.
- Financial Ratios: Assess Chengdu Xgimi's profitability, leverage, and operational efficiency.
- Editable Inputs: Adjust assumptions such as growth rates, profit margins, and capital expenditures to align with your scenarios.
- Financial Statements: Annual and quarterly reports provided for thorough analysis.
- Interactive Dashboard: Effortlessly visualize essential valuation metrics and outcomes.
Disclaimer
All information, articles, and product details provided on this website are for general informational and educational purposes only. We do not claim any ownership over, nor do we intend to infringe upon, any trademarks, copyrights, logos, brand names, or other intellectual property mentioned or depicted on this site. Such intellectual property remains the property of its respective owners, and any references here are made solely for identification or informational purposes, without implying any affiliation, endorsement, or partnership.
We make no representations or warranties, express or implied, regarding the accuracy, completeness, or suitability of any content or products presented. Nothing on this website should be construed as legal, tax, investment, financial, medical, or other professional advice. In addition, no part of this site—including articles or product references—constitutes a solicitation, recommendation, endorsement, advertisement, or offer to buy or sell any securities, franchises, or other financial instruments, particularly in jurisdictions where such activity would be unlawful.
All content is of a general nature and may not address the specific circumstances of any individual or entity. It is not a substitute for professional advice or services. Any actions you take based on the information provided here are strictly at your own risk. You accept full responsibility for any decisions or outcomes arising from your use of this website and agree to release us from any liability in connection with your use of, or reliance upon, the content or products found herein.