
|
Guizhou Zhenhua New Material Co., Ltd. (688707.SS) Valoración de DCF |
Completamente Editable: Adáptelo A Sus Necesidades En Excel O Sheets
Diseño Profesional: Plantillas Confiables Y Estándares De La Industria
Predeterminadas Para Un Uso Rápido Y Eficiente
Compatible con MAC / PC, completamente desbloqueado
No Se Necesita Experiencia; Fáciles De Seguir
Guizhou Zhenhua New Material Co., Ltd. (688707.SS) Bundle
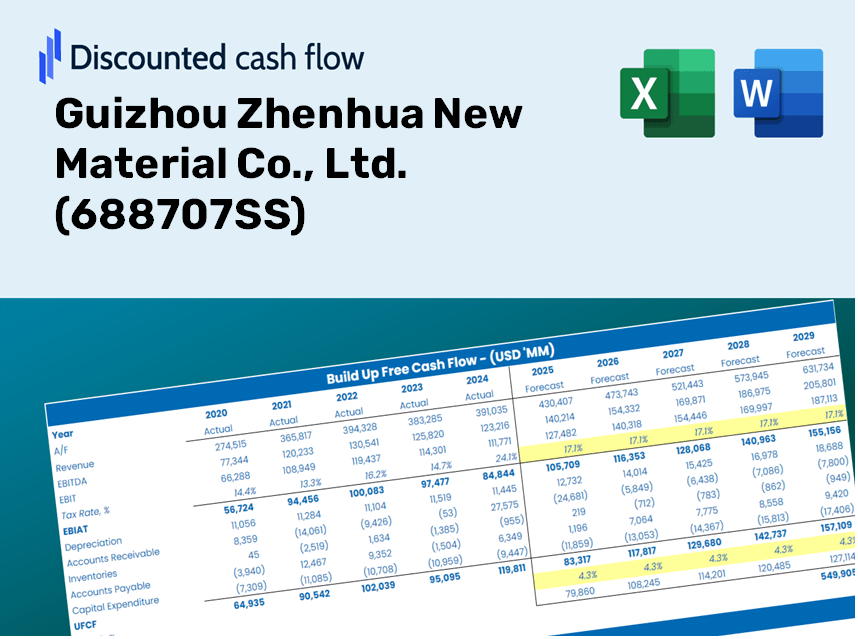
¡Obtenga información sobre su Guizhou Zhenhua New Material Co., Ltd. (688707SS) Análisis de valoración con nuestra sofisticada calculadora DCF! Con datos en tiempo real para (688707SS), esta plantilla de Excel le permite ajustar los pronósticos y supuestos para determinar con precisión el valor intrínseco de Guizhou Zhenhua New Material Co., Ltd.
Discounted Cash Flow (DCF) - (USD MM)
| Year | AY1 2020 |
AY2 2021 |
AY3 2022 |
AY4 2023 |
AY5 2024 |
FY1 2025 |
FY2 2026 |
FY3 2027 |
FY4 2028 |
FY5 2029 |
|---|---|---|---|---|---|---|---|---|---|---|
| Revenue | 1,036.5 | 5,514.9 | 13,935.6 | 6,875.7 | 1,961.1 | 2,342.9 | 2,798.9 | 3,343.8 | 3,994.7 | 4,772.2 |
| Revenue Growth, % | 0 | 432.07 | 152.69 | -50.66 | -71.48 | 19.47 | 19.47 | 19.47 | 19.47 | 19.47 |
| EBITDA | -76.2 | 641.2 | 1,642.2 | 355.9 | -369.1 | 11.3 | 13.5 | 16.1 | 19.3 | 23.0 |
| EBITDA, % | -7.35 | 11.63 | 11.78 | 5.18 | -18.82 | 0.48277 | 0.48277 | 0.48277 | 0.48277 | 0.48277 |
| Depreciation | 81.3 | 116.2 | 135.5 | 192.0 | 222.8 | 117.5 | 140.3 | 167.7 | 200.3 | 239.3 |
| Depreciation, % | 7.84 | 2.11 | 0.97269 | 2.79 | 11.36 | 5.01 | 5.01 | 5.01 | 5.01 | 5.01 |
| EBIT | -157.5 | 525.0 | 1,506.6 | 164.0 | -591.9 | -106.2 | -126.8 | -151.5 | -181.0 | -216.3 |
| EBIT, % | -15.19 | 9.52 | 10.81 | 2.38 | -30.18 | -4.53 | -4.53 | -4.53 | -4.53 | -4.53 |
| Total Cash | 297.5 | 1,471.0 | 1,899.1 | 2,840.0 | 2,232.2 | 985.4 | 1,177.3 | 1,406.4 | 1,680.2 | 2,007.3 |
| Total Cash, percent | .0 | .0 | .0 | .0 | .0 | .0 | .0 | .0 | .0 | .0 |
| Account Receivables | 748.6 | 1,737.9 | 4,392.7 | 1,906.2 | 1,221.3 | 1,055.5 | 1,260.9 | 1,506.4 | 1,799.6 | 2,149.9 |
| Account Receivables, % | 72.22 | 31.51 | 31.52 | 27.72 | 62.28 | 45.05 | 45.05 | 45.05 | 45.05 | 45.05 |
| Inventories | 1,056.5 | 1,519.8 | 1,825.3 | 1,537.9 | 985.6 | 999.4 | 1,193.9 | 1,426.3 | 1,703.9 | 2,035.6 |
| Inventories, % | 101.93 | 27.56 | 13.1 | 22.37 | 50.25 | 42.66 | 42.66 | 42.66 | 42.66 | 42.66 |
| Accounts Payable | 1,148.2 | 1,508.7 | 3,688.0 | 812.1 | 1,136.6 | 1,047.7 | 1,251.6 | 1,495.3 | 1,786.3 | 2,134.0 |
| Accounts Payable, % | 110.78 | 27.36 | 26.46 | 11.81 | 57.96 | 44.72 | 44.72 | 44.72 | 44.72 | 44.72 |
| Capital Expenditure | -157.5 | -297.9 | -844.7 | -258.5 | -149.8 | -178.3 | -213.0 | -254.5 | -304.0 | -363.2 |
| Capital Expenditure, % | -15.19 | -5.4 | -6.06 | -3.76 | -7.64 | -7.61 | -7.61 | -7.61 | -7.61 | -7.61 |
| Tax Rate, % | 16.26 | 16.26 | 16.26 | 16.26 | 16.26 | 16.26 | 16.26 | 16.26 | 16.26 | 16.26 |
| EBITAT | -130.4 | 467.0 | 1,315.3 | 155.1 | -495.7 | -92.9 | -111.0 | -132.6 | -158.4 | -189.2 |
| Depreciation | ||||||||||
| Changes in Account Receivables | ||||||||||
| Changes in Inventories | ||||||||||
| Changes in Accounts Payable | ||||||||||
| Capital Expenditure | ||||||||||
| UFCF | -863.5 | -806.9 | -174.8 | -13.5 | 1,139.0 | -90.6 | -379.7 | -453.6 | -541.9 | -647.4 |
| WACC, % | 4.65 | 4.69 | 4.68 | 4.72 | 4.65 | 4.68 | 4.68 | 4.68 | 4.68 | 4.68 |
| PV UFCF | ||||||||||
| SUM PV UFCF | -1,795.0 | |||||||||
| Long Term Growth Rate, % | 2.00 | |||||||||
| Free cash flow (T + 1) | -660 | |||||||||
| Terminal Value | -24,667 | |||||||||
| Present Terminal Value | -19,627 | |||||||||
| Enterprise Value | -21,422 | |||||||||
| Net Debt | -909 | |||||||||
| Equity Value | -20,513 | |||||||||
| Diluted Shares Outstanding, MM | 503 | |||||||||
| Equity Value Per Share | -40.82 |
Benefits You Will Receive
- Authentic 688707SS Financial Data: Pre-loaded with Guizhou Zhenhua's historical and forecasted data for accurate analysis.
- Completely Customizable Template: Effortlessly adjust key inputs such as revenue growth, WACC, and EBITDA %.
- Instant Calculations: Watch Guizhou Zhenhua's intrinsic value refresh automatically as you make changes.
- Expert Valuation Tool: Tailored for investors, analysts, and consultants in need of reliable DCF results.
- User-Friendly Interface: Straightforward layout and clear guidance suitable for all skill levels.
Key Features
- Customizable Forecast Inputs: Adjust essential metrics such as revenue growth, EBITDA percentage, and capital expenditure projections.
- Instant DCF Valuation: Quickly computes intrinsic value, net present value, and additional financial metrics.
- High-Quality Accuracy: Leverages Guizhou Zhenhua New Material Co., Ltd.'s (688707SS) actual financial data for precise valuation results.
- Simplified Scenario Analysis: Easily evaluate various assumptions and compare the outcomes effectively.
- Efficiency Booster: Reduce the time spent creating detailed valuation models from the ground up.
How It Works
- Download the Template: Gain immediate access to the Excel-based Guizhou Zhenhua New Material Co., Ltd. (688707SS) DCF Calculator.
- Input Your Assumptions: Modify the yellow-highlighted cells for growth rates, WACC, margins, and additional variables.
- Instant Calculations: The model automatically recalculates the intrinsic value of Guizhou Zhenhua New Material Co., Ltd. (688707SS).
- Test Scenarios: Experiment with various assumptions to assess potential shifts in valuation.
- Analyze and Decide: Utilize the outcomes to inform your investment strategy or financial analysis.
Why Choose Guizhou Zhenhua New Material Co., Ltd. (688707SS)?
- User-Friendly Interface: Designed to cater to both novice and experienced users.
- Customizable Inputs: Effortlessly adjust parameters to suit your analysis needs.
- Real-Time Feedback: Observe immediate changes in valuation as you tweak the inputs.
- Pre-Configured Data: Comes with Guizhou Zhenhua's actual financial information for swift evaluation.
- Relied Upon by Experts: A go-to tool for investors and analysts aiming for well-informed decisions.
Who Can Benefit from This Product?
- Institutional Investors: Develop comprehensive and accurate valuation models for analyzing portfolios focused on Guizhou Zhenhua New Material Co., Ltd. (688707SS).
- Corporate Finance Departments: Evaluate valuation scenarios to inform strategic decision-making within the organization.
- Financial Consultants and Advisors: Offer clients precise valuation evaluations for their investments in Guizhou Zhenhua New Material Co., Ltd. (688707SS).
- Students and Educators: Leverage real-world data for training in financial modeling and analysis.
- Industry Analysts: Gain insights into market valuations of materials companies like Guizhou Zhenhua New Material Co., Ltd. (688707SS).
What the Template Includes
- Pre-Filled Data: Features Guizhou Zhenhua New Material Co., Ltd.'s historical financial performance and projections.
- Discounted Cash Flow Model: Customizable DCF valuation model with automated calculations.
- Weighted Average Cost of Capital (WACC): An exclusive sheet for determining WACC using personalized inputs.
- Key Financial Ratios: Evaluate Guizhou Zhenhua's profitability, operational efficiency, and financial leverage.
- Customizable Inputs: Easily modify revenue growth rates, profit margins, and tax assumptions.
- User-Friendly Dashboard: Graphs and tables summarizing vital valuation outcomes.
Disclaimer
All information, articles, and product details provided on this website are for general informational and educational purposes only. We do not claim any ownership over, nor do we intend to infringe upon, any trademarks, copyrights, logos, brand names, or other intellectual property mentioned or depicted on this site. Such intellectual property remains the property of its respective owners, and any references here are made solely for identification or informational purposes, without implying any affiliation, endorsement, or partnership.
We make no representations or warranties, express or implied, regarding the accuracy, completeness, or suitability of any content or products presented. Nothing on this website should be construed as legal, tax, investment, financial, medical, or other professional advice. In addition, no part of this site—including articles or product references—constitutes a solicitation, recommendation, endorsement, advertisement, or offer to buy or sell any securities, franchises, or other financial instruments, particularly in jurisdictions where such activity would be unlawful.
All content is of a general nature and may not address the specific circumstances of any individual or entity. It is not a substitute for professional advice or services. Any actions you take based on the information provided here are strictly at your own risk. You accept full responsibility for any decisions or outcomes arising from your use of this website and agree to release us from any liability in connection with your use of, or reliance upon, the content or products found herein.