
|
Zhuhai Cosmx Battery Co., Ltd. (688772.ss) Valoración de DCF |
Completamente Editable: Adáptelo A Sus Necesidades En Excel O Sheets
Diseño Profesional: Plantillas Confiables Y Estándares De La Industria
Predeterminadas Para Un Uso Rápido Y Eficiente
Compatible con MAC / PC, completamente desbloqueado
No Se Necesita Experiencia; Fáciles De Seguir
Zhuhai CosMX Battery Co., Ltd. (688772.SS) Bundle
¡Descubra el verdadero valor de Zhuhai Cosmx Battery Co., Ltd. (688772SS) con nuestra calculadora DCF avanzada! Ajuste los supuestos esenciales, explore varios escenarios y evalúe cómo las modificaciones afectan la valoración de Zhuhai Cosmx Battery Co., Ltd. (688772SS), todo dentro de una plantilla de Excel conveniente.
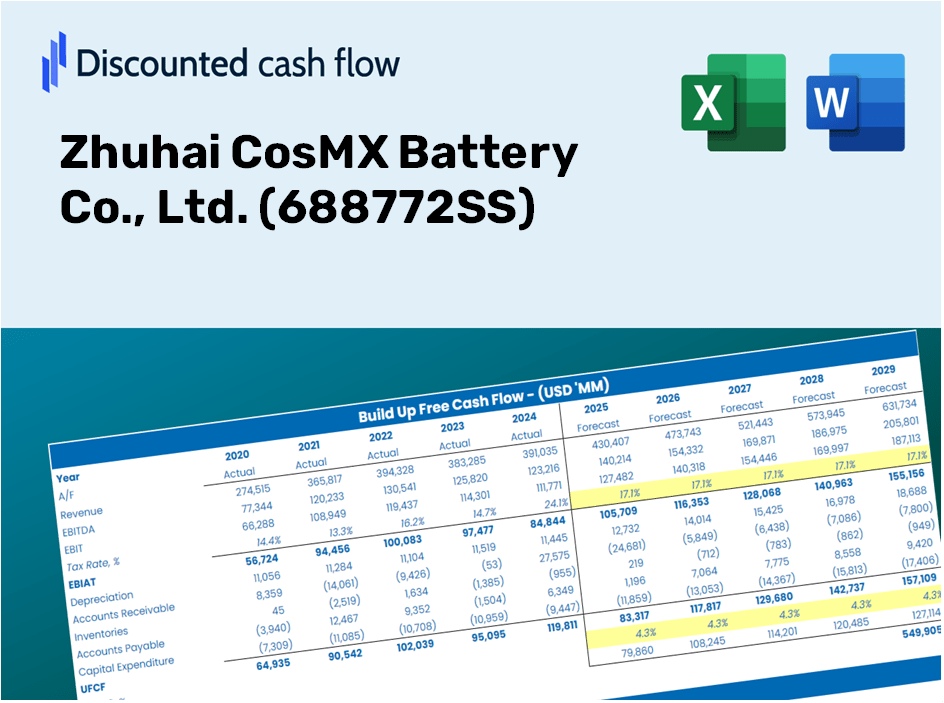
Discounted Cash Flow (DCF) - (USD MM)
| Year | AY1 2020 |
AY2 2021 |
AY3 2022 |
AY4 2023 |
AY5 2024 |
FY1 2025 |
FY2 2026 |
FY3 2027 |
FY4 2028 |
FY5 2029 |
|---|---|---|---|---|---|---|---|---|---|---|
| Revenue | 6,964.2 | 10,340.0 | 10,974.4 | 11,445.6 | 11,541.1 | 13,264.7 | 15,245.7 | 17,522.5 | 20,139.4 | 23,147.1 |
| Revenue Growth, % | 0 | 48.47 | 6.14 | 4.29 | 0.83394 | 14.93 | 14.93 | 14.93 | 14.93 | 14.93 |
| EBITDA | 1,553.0 | 1,811.7 | 1,080.4 | 1,564.5 | 1,846.3 | 2,104.6 | 2,418.9 | 2,780.2 | 3,195.4 | 3,672.6 |
| EBITDA, % | 22.3 | 17.52 | 9.84 | 13.67 | 16 | 15.87 | 15.87 | 15.87 | 15.87 | 15.87 |
| Depreciation | 421.4 | 740.4 | 1,114.1 | 1,493.4 | 1,786.1 | 1,376.5 | 1,582.1 | 1,818.4 | 2,090.0 | 2,402.1 |
| Depreciation, % | 6.05 | 7.16 | 10.15 | 13.05 | 15.48 | 10.38 | 10.38 | 10.38 | 10.38 | 10.38 |
| EBIT | 1,131.5 | 1,071.3 | -33.8 | 71.1 | 60.3 | 728.1 | 836.8 | 961.8 | 1,105.4 | 1,270.5 |
| EBIT, % | 16.25 | 10.36 | -0.30757 | 0.62099 | 0.52235 | 5.49 | 5.49 | 5.49 | 5.49 | 5.49 |
| Total Cash | 1,150.4 | 2,947.1 | 4,449.6 | 4,250.5 | 2,859.6 | 3,912.5 | 4,496.8 | 5,168.4 | 5,940.3 | 6,827.4 |
| Total Cash, percent | .0 | .0 | .0 | .0 | .0 | .0 | .0 | .0 | .0 | .0 |
| Account Receivables | 2,439.0 | 3,183.0 | 3,061.5 | 3,381.9 | 3,704.3 | 4,121.3 | 4,736.8 | 5,444.2 | 6,257.2 | 7,191.7 |
| Account Receivables, % | 35.02 | 30.78 | 27.9 | 29.55 | 32.1 | 31.07 | 31.07 | 31.07 | 31.07 | 31.07 |
| Inventories | 1,047.9 | 2,353.0 | 2,047.0 | 1,950.8 | 1,892.2 | 2,384.8 | 2,741.0 | 3,150.4 | 3,620.9 | 4,161.6 |
| Inventories, % | 15.05 | 22.76 | 18.65 | 17.04 | 16.4 | 17.98 | 17.98 | 17.98 | 17.98 | 17.98 |
| Accounts Payable | 3,215.9 | 6,266.3 | 5,401.1 | 4,392.1 | 5,498.3 | 6,420.4 | 7,379.2 | 8,481.3 | 9,747.9 | 11,203.7 |
| Accounts Payable, % | 46.18 | 60.6 | 49.22 | 38.37 | 47.64 | 48.4 | 48.4 | 48.4 | 48.4 | 48.4 |
| Capital Expenditure | -1,658.8 | -3,715.5 | -3,250.4 | -3,296.9 | -3,022.4 | -3,829.9 | -4,401.8 | -5,059.2 | -5,814.8 | -6,683.2 |
| Capital Expenditure, % | -23.82 | -35.93 | -29.62 | -28.8 | -26.19 | -28.87 | -28.87 | -28.87 | -28.87 | -28.87 |
| Tax Rate, % | -292.1 | -292.1 | -292.1 | -292.1 | -292.1 | -292.1 | -292.1 | -292.1 | -292.1 | -292.1 |
| EBITAT | 988.4 | 989.2 | 29.0 | 407.6 | 236.4 | 552.9 | 635.5 | 730.4 | 839.4 | 964.8 |
| Depreciation | ||||||||||
| Changes in Account Receivables | ||||||||||
| Changes in Inventories | ||||||||||
| Changes in Accounts Payable | ||||||||||
| Capital Expenditure | ||||||||||
| UFCF | -520.0 | -984.5 | -2,545.0 | -2,629.1 | -157.5 | -1,887.9 | -2,197.1 | -2,525.2 | -2,902.3 | -3,335.7 |
| WACC, % | 8.98 | 9.02 | 8.37 | 9.07 | 9.07 | 8.9 | 8.9 | 8.9 | 8.9 | 8.9 |
| PV UFCF | ||||||||||
| SUM PV UFCF | -9,782.7 | |||||||||
| Long Term Growth Rate, % | 2.00 | |||||||||
| Free cash flow (T + 1) | -3,402 | |||||||||
| Terminal Value | -49,300 | |||||||||
| Present Terminal Value | -32,187 | |||||||||
| Enterprise Value | -41,969 | |||||||||
| Net Debt | 3,100 | |||||||||
| Equity Value | -45,070 | |||||||||
| Diluted Shares Outstanding, MM | 1,121 | |||||||||
| Equity Value Per Share | -40.21 |
Benefits of Choosing Us
- Comprehensive Financial Model: Utilize Zhuhai CosMX Battery Co., Ltd.'s actual data for accurate DCF valuation.
- Complete Forecasting Flexibility: Modify revenue growth rates, profit margins, WACC, and other essential variables.
- Real-Time Calculations: Enjoy automatic updates that reflect changes instantly.
- Professional-Grade Template: A polished Excel workbook crafted for premium valuation needs.
- Customizable and Reusable: Designed for adaptability, allowing for repeated and detailed forecasting.
Core Features
- Comprehensive DCF Calculator: Offers in-depth unlevered and levered DCF valuation frameworks.
- WACC Estimator: Pre-configured Weighted Average Cost of Capital spreadsheet with adjustable parameters.
- Customizable Forecast Variables: Alter growth projections, capital investment, and discount rates as needed.
- Integrated Financial Ratios: Evaluate profitability, leverage, and efficiency ratios specifically for Zhuhai CosMX Battery Co., Ltd. (688772SS).
- Interactive Dashboard and Visuals: Graphical representations highlight essential valuation metrics for simplified analysis.
How It Functions
- Step 1: Download the Excel spreadsheet.
- Step 2: Examine the pre-filled data for Zhuhai CosMX Battery Co., Ltd. (688772SS) (historical and forecasted).
- Step 3: Modify key assumptions (highlighted in yellow) according to your evaluation.
- Step 4: Observe automatic recalculations reflecting the intrinsic value of Zhuhai CosMX Battery Co., Ltd. (688772SS).
- Step 5: Utilize the results for making investment decisions or for reporting purposes.
Why Choose This Calculator for Zhuhai CosMX Battery Co., Ltd. (688772SS)?
- Designed for Experts: A sophisticated tool utilized by industry analysts, CFOs, and business consultants.
- Accurate Financial Data: Historical and projected financial information for CosMX preloaded for precision.
- Forecast Simulations: Effortlessly run various scenarios and test different assumptions.
- Comprehensive Outputs: Automatically computes intrinsic value, NPV, and essential financial metrics.
- User-Friendly: Detailed step-by-step instructions make the process straightforward.
Who Should Utilize This Product?
- Individual Investors: Gain insights to make informed decisions about trading shares of Zhuhai CosMX Battery Co., Ltd. (688772SS).
- Financial Analysts: Enhance valuation processes with comprehensive financial models tailored for CosMX.
- Consultants: Provide accurate and timely valuation analysis for clients focused on the battery industry.
- Business Owners: Learn how major players like Zhuhai CosMX are valued to inform your business strategies.
- Finance Students: Explore valuation methods using real-life data and case studies related to CosMX.
Contents of the Template
- Detailed DCF Model: Fully editable template featuring in-depth valuation calculations.
- Company-Specific Data: Preloaded historical and projected financial information for Zhuhai CosMX Battery Co., Ltd. (688772SS) to facilitate analysis.
- Adjustable Variables: Modify WACC, growth rates, and tax assumptions to explore different scenarios.
- Comprehensive Financial Statements: Complete annual and quarterly reports for enhanced insights.
- Key Financial Ratios: Integrated analysis for evaluating profitability, efficiency, and leverage.
- Visual Dashboard: Charts and tables designed for clear, actionable insights.
Disclaimer
All information, articles, and product details provided on this website are for general informational and educational purposes only. We do not claim any ownership over, nor do we intend to infringe upon, any trademarks, copyrights, logos, brand names, or other intellectual property mentioned or depicted on this site. Such intellectual property remains the property of its respective owners, and any references here are made solely for identification or informational purposes, without implying any affiliation, endorsement, or partnership.
We make no representations or warranties, express or implied, regarding the accuracy, completeness, or suitability of any content or products presented. Nothing on this website should be construed as legal, tax, investment, financial, medical, or other professional advice. In addition, no part of this site—including articles or product references—constitutes a solicitation, recommendation, endorsement, advertisement, or offer to buy or sell any securities, franchises, or other financial instruments, particularly in jurisdictions where such activity would be unlawful.
All content is of a general nature and may not address the specific circumstances of any individual or entity. It is not a substitute for professional advice or services. Any actions you take based on the information provided here are strictly at your own risk. You accept full responsibility for any decisions or outcomes arising from your use of this website and agree to release us from any liability in connection with your use of, or reliance upon, the content or products found herein.