
|
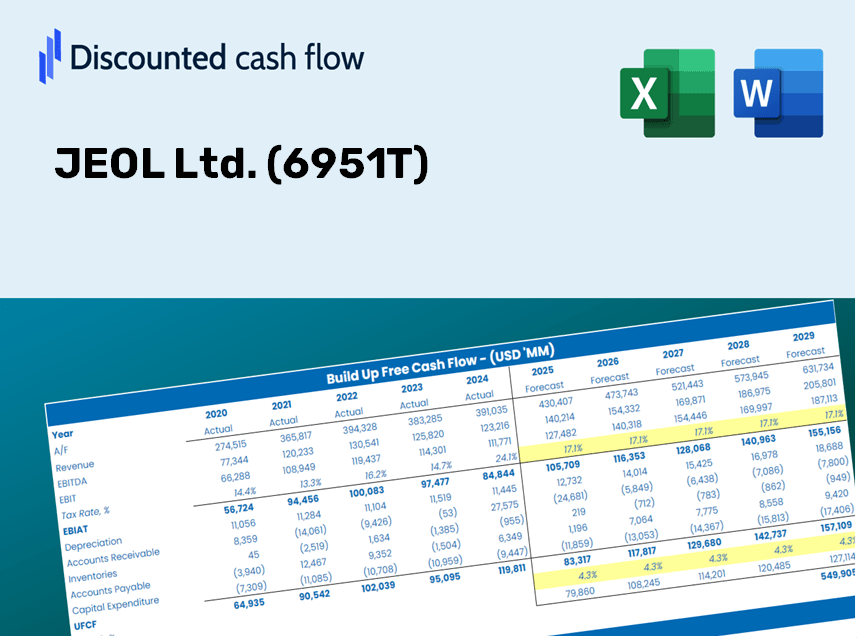
Jeol Ltd. (6951.T) Valoración de DCF |
Completamente Editable: Adáptelo A Sus Necesidades En Excel O Sheets
Diseño Profesional: Plantillas Confiables Y Estándares De La Industria
Predeterminadas Para Un Uso Rápido Y Eficiente
Compatible con MAC / PC, completamente desbloqueado
No Se Necesita Experiencia; Fáciles De Seguir
JEOL Ltd. (6951.T) Bundle
¡Mejore sus opciones de inversión con la calculadora DCF JEOL Ltd. (6951T)! Explore datos financieros precisos, ajuste las proyecciones y gastos de crecimiento, y observe cómo estas modificaciones afectan el valor intrínseco de JEOL Ltd. (6951T) en tiempo real.
Discounted Cash Flow (DCF) - (USD MM)
| Year | AY1 2020 |
AY2 2021 |
AY3 2022 |
AY4 2023 |
AY5 2024 |
FY1 2025 |
FY2 2026 |
FY3 2027 |
FY4 2028 |
FY5 2029 |
|---|---|---|---|---|---|---|---|---|---|---|
| Revenue | 110,439.0 | 138,408.0 | 162,689.0 | 174,336.0 | 196,695.0 | 227,602.0 | 263,365.5 | 304,748.5 | 352,634.1 | 408,044.1 |
| Revenue Growth, % | 0 | 25.33 | 17.54 | 7.16 | 12.83 | 15.71 | 15.71 | 15.71 | 15.71 | 15.71 |
| EBITDA | 9,441.0 | 18,479.0 | 28,710.0 | 34,306.0 | 30,263.0 | 33,963.1 | 39,299.8 | 45,475.0 | 52,620.6 | 60,888.9 |
| EBITDA, % | 8.55 | 13.35 | 17.65 | 19.68 | 15.39 | 14.92 | 14.92 | 14.92 | 14.92 | 14.92 |
| Depreciation | 4,216.0 | 4,334.0 | 4,922.0 | 4,747.0 | 5,178.0 | 6,978.1 | 8,074.6 | 9,343.4 | 10,811.5 | 12,510.3 |
| Depreciation, % | 3.82 | 3.13 | 3.03 | 2.72 | 2.63 | 3.07 | 3.07 | 3.07 | 3.07 | 3.07 |
| EBIT | 5,225.0 | 14,145.0 | 23,788.0 | 29,559.0 | 25,085.0 | 26,985.0 | 31,225.2 | 36,131.7 | 41,809.1 | 48,378.6 |
| EBIT, % | 4.73 | 10.22 | 14.62 | 16.96 | 12.75 | 11.86 | 11.86 | 11.86 | 11.86 | 11.86 |
| Total Cash | 15,376.0 | 44,226.0 | 34,254.0 | 31,504.0 | 36,144.0 | 47,057.8 | 54,452.1 | 63,008.2 | 72,908.8 | 84,365.1 |
| Total Cash, percent | .0 | .0 | .0 | .0 | .0 | .0 | .0 | .0 | .0 | .0 |
| Account Receivables | 31,239.0 | 40,591.0 | 49,507.0 | 55,184.0 | 54,108.0 | 67,008.8 | 77,538.0 | 89,721.7 | 103,819.8 | 120,133.2 |
| Account Receivables, % | 28.29 | 29.33 | 30.43 | 31.65 | 27.51 | 29.44 | 29.44 | 29.44 | 29.44 | 29.44 |
| Inventories | 57,294.0 | 59,110.0 | 68,753.0 | 76,810.0 | 77,017.0 | 100,172.2 | 115,912.4 | 134,125.9 | 155,201.3 | 179,588.4 |
| Inventories, % | 51.88 | 42.71 | 42.26 | 44.06 | 39.16 | 44.01 | 44.01 | 44.01 | 44.01 | 44.01 |
| Accounts Payable | 12,002.0 | 13,650.0 | 15,410.0 | 29,512.0 | 15,874.0 | 25,127.4 | 29,075.7 | 33,644.4 | 38,931.0 | 45,048.3 |
| Accounts Payable, % | 10.87 | 9.86 | 9.47 | 16.93 | 8.07 | 11.04 | 11.04 | 11.04 | 11.04 | 11.04 |
| Capital Expenditure | -7,029.0 | -1,515.0 | -6,389.0 | -3,475.0 | -2,960.0 | -6,775.5 | -7,840.1 | -9,072.0 | -10,497.5 | -12,147.0 |
| Capital Expenditure, % | -6.36 | -1.09 | -3.93 | -1.99 | -1.5 | -2.98 | -2.98 | -2.98 | -2.98 | -2.98 |
| Tax Rate, % | 25.13 | 25.13 | 25.13 | 25.13 | 25.13 | 25.13 | 25.13 | 25.13 | 25.13 | 25.13 |
| EBITAT | 3,485.5 | 10,430.1 | 17,884.9 | 21,768.8 | 18,780.1 | 19,652.7 | 22,740.8 | 26,314.0 | 30,448.8 | 35,233.3 |
| Depreciation | ||||||||||
| Changes in Account Receivables | ||||||||||
| Changes in Inventories | ||||||||||
| Changes in Accounts Payable | ||||||||||
| Capital Expenditure | ||||||||||
| UFCF | -75,858.5 | 3,729.1 | -381.1 | 23,408.8 | 8,229.1 | -6,947.3 | 654.1 | 756.9 | 875.8 | 1,013.5 |
| WACC, % | 11.87 | 11.88 | 11.88 | 11.88 | 11.88 | 11.88 | 11.88 | 11.88 | 11.88 | 11.88 |
| PV UFCF | ||||||||||
| SUM PV UFCF | -4,009.4 | |||||||||
| Long Term Growth Rate, % | 2.00 | |||||||||
| Free cash flow (T + 1) | 1,034 | |||||||||
| Terminal Value | 10,461 | |||||||||
| Present Terminal Value | 5,967 | |||||||||
| Enterprise Value | 1,958 | |||||||||
| Net Debt | -26,860 | |||||||||
| Equity Value | 28,818 | |||||||||
| Diluted Shares Outstanding, MM | 51 | |||||||||
| Equity Value Per Share | 563.68 |
What You Will Receive
- Pre-Filled Financial Model: JEOL Ltd.'s actual data enables accurate DCF valuation.
- Comprehensive Forecast Control: Modify revenue growth, profit margins, WACC, and other critical factors.
- Instantaneous Calculations: Automatic updates allow you to view results in real-time as you make adjustments.
- Investor-Ready Template: A polished Excel file crafted for high-quality professional valuation.
- Customizable and Reusable: Designed for flexibility, facilitating repeated use for detailed projections.
Key Features
- Customizable Financial Inputs: Adjust essential parameters such as revenue projections, EBITDA percentage, and capital investments.
- Instant DCF Valuation: Quickly derives intrinsic value, net present value (NPV), and other key metrics.
- High-Precision Accuracy: Utilizes JEOL Ltd.'s (6951T) actual financial data for credible valuation results.
- Simplified Scenario Analysis: Easily evaluate varying assumptions and review the results side-by-side.
- Efficiency Booster: Streamlines the process by removing the need to create intricate valuation models from the ground up.
How It Works
- Step 1: Download the Excel file.
- Step 2: Review JEOL Ltd.'s (6951T) pre-filled financial data and projections.
- Step 3: Adjust key parameters such as revenue growth, WACC, and tax rates (highlighted cells).
- Step 4: Observe the DCF model update in real-time as you modify your assumptions.
- Step 5: Evaluate the outputs and utilize the results to inform your investment choices.
Why Choose This Calculator for JEOL Ltd. (6951T)?
- Precision: Leveraging accurate JEOL financial data guarantees dependable results.
- Adaptability: Tailored for users to easily adjust and test various inputs.
- Efficiency: Eliminate the need to create a DCF model from scratch.
- High-Quality: Crafted with the accuracy and functionality expected at the CFO level.
- Intuitive: Simple to navigate, making it accessible for users with varying levels of financial expertise.
Who Can Benefit from This Product?
- Investors: Evaluate JEOL Ltd.’s (6951T) market value before making investment decisions.
- CFOs and Financial Analysts: Optimize valuation methods and assess financial forecasts.
- Startup Founders: Gain insights into how leading companies like JEOL Ltd. are appraised.
- Consultants: Create comprehensive valuation reports for your clientele.
- Students and Educators: Utilize actual data to practice and teach valuation methodologies.
Contents of the Template
- Detailed DCF Model: Editable template featuring comprehensive valuation calculations.
- Current Data: JEOL Ltd.’s (6951T) historical and projected financials preloaded for your analysis.
- Adjustable Parameters: Modify WACC, growth rates, and tax assumptions to explore different scenarios.
- Financial Statements: Complete annual and quarterly breakdowns for enhanced insights.
- Key Financial Ratios: Integrated analysis for profitability, efficiency, and capital structure.
- Visual Dashboard: Charts and tables designed for clear, actionable insights.
Disclaimer
All information, articles, and product details provided on this website are for general informational and educational purposes only. We do not claim any ownership over, nor do we intend to infringe upon, any trademarks, copyrights, logos, brand names, or other intellectual property mentioned or depicted on this site. Such intellectual property remains the property of its respective owners, and any references here are made solely for identification or informational purposes, without implying any affiliation, endorsement, or partnership.
We make no representations or warranties, express or implied, regarding the accuracy, completeness, or suitability of any content or products presented. Nothing on this website should be construed as legal, tax, investment, financial, medical, or other professional advice. In addition, no part of this site—including articles or product references—constitutes a solicitation, recommendation, endorsement, advertisement, or offer to buy or sell any securities, franchises, or other financial instruments, particularly in jurisdictions where such activity would be unlawful.
All content is of a general nature and may not address the specific circumstances of any individual or entity. It is not a substitute for professional advice or services. Any actions you take based on the information provided here are strictly at your own risk. You accept full responsibility for any decisions or outcomes arising from your use of this website and agree to release us from any liability in connection with your use of, or reliance upon, the content or products found herein.