
|
Nitto Denko Corporation (6988.T) Valoración de DCF |
Completamente Editable: Adáptelo A Sus Necesidades En Excel O Sheets
Diseño Profesional: Plantillas Confiables Y Estándares De La Industria
Predeterminadas Para Un Uso Rápido Y Eficiente
Compatible con MAC / PC, completamente desbloqueado
No Se Necesita Experiencia; Fáciles De Seguir
Nitto Denko Corporation (6988.T) Bundle
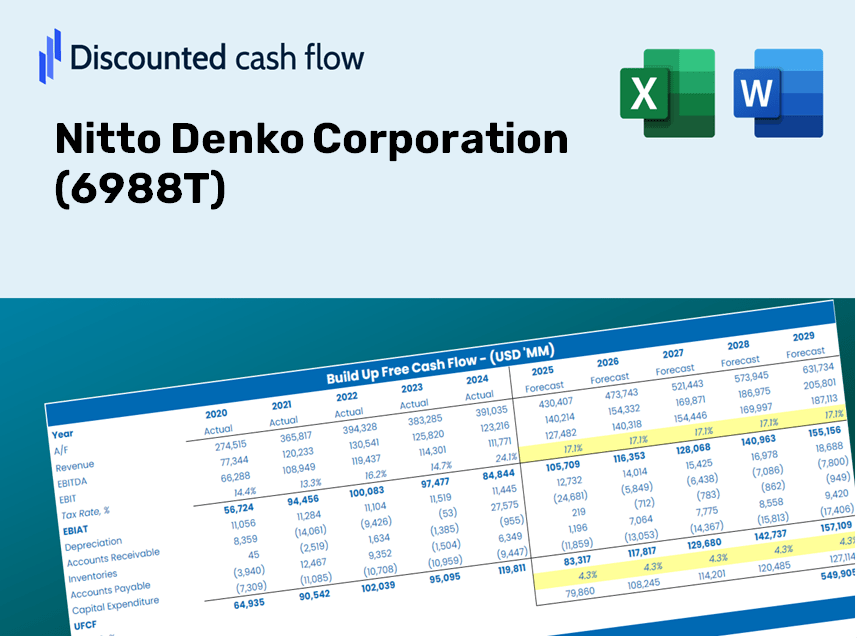
¡Agilice su análisis y mejore la precisión con nuestra calculadora DCF (6988T)! Utilizando datos reales de Nitto Denko Corporation y suposiciones personalizables, esta herramienta le permite pronosticar, evaluar y valor (6988T) al igual que un inversor experimentado.
Discounted Cash Flow (DCF) - (USD MM)
| Year | AY1 2021 |
AY2 2022 |
AY3 2023 |
AY4 2024 |
AY5 2025 |
FY1 2026 |
FY2 2027 |
FY3 2028 |
FY4 2029 |
FY5 2030 |
|---|---|---|---|---|---|---|---|---|---|---|
| Revenue | 761,321.0 | 853,448.0 | 929,036.0 | 915,139.0 | 1,013,878.0 | 1,090,556.0 | 1,173,033.1 | 1,261,747.7 | 1,357,171.7 | 1,459,812.5 |
| Revenue Growth, % | 0 | 12.1 | 8.86 | -1.5 | 10.79 | 7.56 | 7.56 | 7.56 | 7.56 | 7.56 |
| EBITDA | 142,343.0 | 183,973.0 | 205,006.0 | 200,840.0 | 254,164.0 | 238,471.2 | 256,506.4 | 275,905.6 | 296,771.9 | 319,216.3 |
| EBITDA, % | 18.7 | 21.56 | 22.07 | 21.95 | 25.07 | 21.87 | 21.87 | 21.87 | 21.87 | 21.87 |
| Depreciation | 47,950.0 | 50,211.0 | 57,362.0 | 60,811.0 | 65,595.0 | 68,641.0 | 73,832.2 | 79,416.0 | 85,422.1 | 91,882.5 |
| Depreciation, % | 6.3 | 5.88 | 6.17 | 6.65 | 6.47 | 6.29 | 6.29 | 6.29 | 6.29 | 6.29 |
| EBIT | 94,393.0 | 133,762.0 | 147,644.0 | 140,029.0 | 188,569.0 | 169,830.2 | 182,674.2 | 196,489.6 | 211,349.8 | 227,333.9 |
| EBIT, % | 12.4 | 15.67 | 15.89 | 15.3 | 18.6 | 15.57 | 15.57 | 15.57 | 15.57 | 15.57 |
| Total Cash | 302,287.0 | 362,046.0 | 329,966.0 | 342,269.0 | 363,344.0 | 416,335.0 | 447,821.8 | 481,689.9 | 518,119.3 | 557,303.9 |
| Total Cash, percent | .0 | .0 | .0 | .0 | .0 | .0 | .0 | .0 | .0 | .0 |
| Account Receivables | 182,939.0 | 206,084.0 | 178,388.0 | 209,341.0 | 210,418.0 | 242,118.5 | 260,429.5 | 280,125.4 | 301,310.8 | 324,098.5 |
| Account Receivables, % | 24.03 | 24.15 | 19.2 | 22.88 | 20.75 | 22.2 | 22.2 | 22.2 | 22.2 | 22.2 |
| Inventories | 107,668.0 | 128,318.0 | 141,101.0 | 136,804.0 | 142,932.0 | 160,119.7 | 172,229.3 | 185,254.7 | 199,265.2 | 214,335.3 |
| Inventories, % | 14.14 | 15.04 | 15.19 | 14.95 | 14.1 | 14.68 | 14.68 | 14.68 | 14.68 | 14.68 |
| Accounts Payable | 77,964.0 | 78,261.0 | 64,836.0 | 100,508.0 | 100,508.0 | 103,134.9 | 110,934.9 | 119,324.7 | 128,349.0 | 138,055.9 |
| Accounts Payable, % | 10.24 | 9.17 | 6.98 | 10.98 | 9.91 | 9.46 | 9.46 | 9.46 | 9.46 | 9.46 |
| Capital Expenditure | -57,724.0 | -58,958.0 | -65,921.0 | -67,774.0 | -106,003.0 | -86,038.3 | -92,545.3 | -99,544.3 | -107,072.7 | -115,170.5 |
| Capital Expenditure, % | -7.58 | -6.91 | -7.1 | -7.41 | -10.46 | -7.89 | -7.89 | -7.89 | -7.89 | -7.89 |
| Tax Rate, % | 25.99 | 25.99 | 25.99 | 25.99 | 25.99 | 25.99 | 25.99 | 25.99 | 25.99 | 25.99 |
| EBITAT | 71,042.6 | 98,147.5 | 109,770.8 | 103,512.8 | 139,554.9 | 125,985.3 | 135,513.3 | 145,762.0 | 156,785.8 | 168,643.2 |
| Depreciation | ||||||||||
| Changes in Account Receivables | ||||||||||
| Changes in Inventories | ||||||||||
| Changes in Accounts Payable | ||||||||||
| Capital Expenditure | ||||||||||
| UFCF | -151,374.4 | 45,902.5 | 102,699.8 | 105,565.8 | 91,941.9 | 62,326.8 | 94,179.6 | 101,302.2 | 108,963.6 | 117,204.3 |
| WACC, % | 6.64 | 6.64 | 6.64 | 6.64 | 6.64 | 6.64 | 6.64 | 6.64 | 6.64 | 6.64 |
| PV UFCF | ||||||||||
| SUM PV UFCF | 394,064.1 | |||||||||
| Long Term Growth Rate, % | 1.00 | |||||||||
| Free cash flow (T + 1) | 118,376 | |||||||||
| Terminal Value | 2,099,754 | |||||||||
| Present Terminal Value | 1,522,706 | |||||||||
| Enterprise Value | 1,916,770 | |||||||||
| Net Debt | -362,889 | |||||||||
| Equity Value | 2,279,659 | |||||||||
| Diluted Shares Outstanding, MM | 702 | |||||||||
| Equity Value Per Share | 3,245.46 |
What You Will Receive
- Authentic Nitto Denko Data: Preloaded financial metrics – including revenue and EBIT – derived from actual and projected data.
- Comprehensive Customization: Modify all essential parameters (yellow cells) such as WACC, growth %, and tax rates to fit your analysis.
- Real-Time Valuation Adjustments: Automatic recalculations to assess the influence of modifications on Nitto Denko’s fair value.
- Flexible Excel Template: Designed for effortless edits, scenario analyses, and in-depth projections.
- Efficient and Precise: Avoid the hassle of building models from the ground up while ensuring accuracy and adaptability.
Key Features
- Customizable Forecast Inputs: Adjust essential variables such as revenue growth, EBITDA margin, and capital expenditures.
- Instant DCF Valuation: Quickly calculates intrinsic value, NPV, and other financial metrics.
- Top-Tier Precision: Leverages Nitto Denko Corporation’s (6988T) actual financial data for accurate valuation results.
- Simplified Scenario Analysis: Easily explore various assumptions and assess their impacts on outcomes.
- Efficiency Booster: Streamlines the valuation process by eliminating the need to develop complex models from the ground up.
How It Functions
- Download: Obtain the pre-configured Excel file containing Nitto Denko Corporation’s (6988T) financial information.
- Customize: Modify forecasts, such as revenue growth, EBITDA percentage, and WACC.
- Automatic Updates: The intrinsic value and NPV calculations refresh in real time.
- Scenario Testing: Generate multiple forecasts and analyze outcomes immediately.
- Informed Decisions: Leverage the valuation findings to shape your investment approach.
Why Opt for the Nitto Denko Calculator?
- Save Time: Skip the hassle of building a DCF model from the ground up – it's ready for immediate use.
- Enhance Accuracy: Dependable financial data and calculations minimize valuation errors.
- Completely Customizable: Adjust the model to align with your own assumptions and forecasts.
- User-Friendly Interface: Transparent charts and outputs simplify data interpretation.
- Endorsed by Professionals: Tailored for experts who prioritize accuracy and functionality.
Who Can Benefit from This Product?
- Investors: Accurately assess the fair value of Nitto Denko Corporation (6988T) before making investment choices.
- Financial Officers: Utilize a high-quality DCF model for effective financial reporting and analysis.
- Consultants: Easily customize the template for client valuation reports.
- Entrepreneurs: Discover financial modeling insights employed by leading companies.
- Educators: Employ it as a pedagogical tool to illustrate valuation techniques.
Overview of the Template
- Detailed DCF Model: An editable template featuring in-depth valuation calculations.
- Current Market Data: Nitto Denko Corporation’s (6988T) historical and projected financials included for in-depth analysis.
- Adjustable Variables: Modify WACC, growth rates, and tax assumptions to explore different scenarios.
- Comprehensive Financial Statements: Complete annual and quarterly data for thorough insights.
- Essential Ratios: Inbuilt analysis for assessing profitability, efficiency, and leverage.
- Interactive Dashboard with Visual Outputs: Charts and tables providing clear, actionable insights.
Disclaimer
All information, articles, and product details provided on this website are for general informational and educational purposes only. We do not claim any ownership over, nor do we intend to infringe upon, any trademarks, copyrights, logos, brand names, or other intellectual property mentioned or depicted on this site. Such intellectual property remains the property of its respective owners, and any references here are made solely for identification or informational purposes, without implying any affiliation, endorsement, or partnership.
We make no representations or warranties, express or implied, regarding the accuracy, completeness, or suitability of any content or products presented. Nothing on this website should be construed as legal, tax, investment, financial, medical, or other professional advice. In addition, no part of this site—including articles or product references—constitutes a solicitation, recommendation, endorsement, advertisement, or offer to buy or sell any securities, franchises, or other financial instruments, particularly in jurisdictions where such activity would be unlawful.
All content is of a general nature and may not address the specific circumstances of any individual or entity. It is not a substitute for professional advice or services. Any actions you take based on the information provided here are strictly at your own risk. You accept full responsibility for any decisions or outcomes arising from your use of this website and agree to release us from any liability in connection with your use of, or reliance upon, the content or products found herein.