
|
Lifenet Insurance Company (7157.T) Valoración de DCF |
Completamente Editable: Adáptelo A Sus Necesidades En Excel O Sheets
Diseño Profesional: Plantillas Confiables Y Estándares De La Industria
Predeterminadas Para Un Uso Rápido Y Eficiente
Compatible con MAC / PC, completamente desbloqueado
No Se Necesita Experiencia; Fáciles De Seguir
Lifenet Insurance Company (7157.T) Bundle
¡Explore el potencial financiero de Lifenet Insurance Company (7157T) con nuestra calculadora DCF fácil de usar! Ingrese sus proyecciones para el crecimiento, los márgenes y los gastos para determinar el valor intrínseco de Lifenet Insurance Company (7157T) y mejorar sus decisiones de inversión.
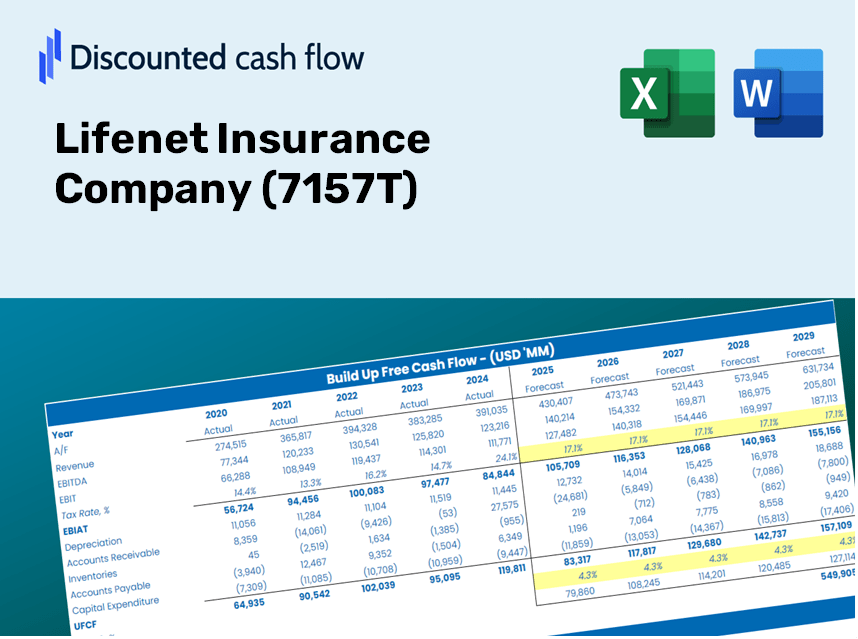
Discounted Cash Flow (DCF) - (USD MM)
| Year | AY1 2020 |
AY2 2021 |
AY3 2022 |
AY4 2023 |
AY5 2024 |
FY1 2025 |
FY2 2026 |
FY3 2027 |
FY4 2028 |
FY5 2029 |
|---|---|---|---|---|---|---|---|---|---|---|
| Revenue | 20,785.0 | 26,157.0 | 29,900.0 | 24,996.0 | 29,288.0 | 32,284.5 | 35,587.6 | 39,228.6 | 43,242.2 | 47,666.4 |
| Revenue Growth, % | 0 | 25.85 | 14.31 | -16.4 | 17.17 | 10.23 | 10.23 | 10.23 | 10.23 | 10.23 |
| EBITDA | -2,741.0 | -2,924.0 | 5,897.0 | 8,882.0 | 10,127.0 | 4,227.2 | 4,659.7 | 5,136.4 | 5,661.9 | 6,241.2 |
| EBITDA, % | -13.19 | -11.18 | 19.72 | 35.53 | 34.58 | 13.09 | 13.09 | 13.09 | 13.09 | 13.09 |
| Depreciation | 364.0 | 390.0 | 554.0 | 631.0 | 948.0 | 701.0 | 772.7 | 851.8 | 938.9 | 1,035.0 |
| Depreciation, % | 1.75 | 1.49 | 1.85 | 2.52 | 3.24 | 2.17 | 2.17 | 2.17 | 2.17 | 2.17 |
| EBIT | -3,105.0 | -3,314.0 | 5,343.0 | 8,251.0 | 9,179.0 | 3,526.2 | 3,886.9 | 4,284.6 | 4,723.0 | 5,206.2 |
| EBIT, % | -14.94 | -12.67 | 17.87 | 33.01 | 31.34 | 10.92 | 10.92 | 10.92 | 10.92 | 10.92 |
| Total Cash | 2,059.0 | 3,761.0 | 5,719.0 | 24,423.0 | 17,234.0 | 12,911.4 | 14,232.4 | 15,688.5 | 17,293.6 | 19,063.0 |
| Total Cash, percent | .0 | .0 | .0 | .0 | .0 | .0 | .0 | .0 | .0 | .0 |
| Account Receivables | 4,011.0 | 5,574.0 | 5,603.0 | .0 | .0 | 3,831.9 | 4,224.0 | 4,656.2 | 5,132.5 | 5,657.7 |
| Account Receivables, % | 19.3 | 21.31 | 18.74 | 0 | 0 | 11.87 | 11.87 | 11.87 | 11.87 | 11.87 |
| Inventories | .0 | .0 | .0 | .0 | .0 | .0 | .0 | .0 | .0 | .0 |
| Inventories, % | 0 | 0 | 0 | 0 | 0 | 0 | 0 | 0 | 0 | 0 |
| Accounts Payable | 370.0 | 452.0 | 559.0 | 1,464.0 | .0 | 725.4 | 799.6 | 881.4 | 971.6 | 1,071.0 |
| Accounts Payable, % | 1.78 | 1.73 | 1.87 | 5.86 | 0 | 2.25 | 2.25 | 2.25 | 2.25 | 2.25 |
| Capital Expenditure | -830.0 | -516.0 | -584.0 | -783.0 | -1,177.0 | -973.1 | -1,072.6 | -1,182.4 | -1,303.4 | -1,436.7 |
| Capital Expenditure, % | -3.99 | -1.97 | -1.95 | -3.13 | -4.02 | -3.01 | -3.01 | -3.01 | -3.01 | -3.01 |
| Tax Rate, % | 34.72 | 34.72 | 34.72 | 34.72 | 34.72 | 34.72 | 34.72 | 34.72 | 34.72 | 34.72 |
| EBITAT | -3,110.0 | -3,319.0 | 3,562.0 | 5,734.0 | 5,992.0 | 2,831.1 | 3,120.8 | 3,440.1 | 3,792.0 | 4,180.0 |
| Depreciation | ||||||||||
| Changes in Account Receivables | ||||||||||
| Changes in Inventories | ||||||||||
| Changes in Accounts Payable | ||||||||||
| Capital Expenditure | ||||||||||
| UFCF | -7,217.0 | -4,926.0 | 3,610.0 | 12,090.0 | 4,299.0 | -547.5 | 2,503.0 | 2,759.1 | 3,041.4 | 3,352.5 |
| WACC, % | 5.18 | 5.18 | 5.17 | 5.17 | 5.17 | 5.17 | 5.17 | 5.17 | 5.17 | 5.17 |
| PV UFCF | ||||||||||
| SUM PV UFCF | 9,205.7 | |||||||||
| Long Term Growth Rate, % | 2.00 | |||||||||
| Free cash flow (T + 1) | 3,420 | |||||||||
| Terminal Value | 107,855 | |||||||||
| Present Terminal Value | 83,825 | |||||||||
| Enterprise Value | 93,030 | |||||||||
| Net Debt | -15,940 | |||||||||
| Equity Value | 108,970 | |||||||||
| Diluted Shares Outstanding, MM | 80 | |||||||||
| Equity Value Per Share | 1,356.69 |
Benefits You Will Receive
- Pre-Loaded Financial Model: Lifenet Insurance Company's actual data ensures accurate DCF valuation.
- Comprehensive Forecast Management: Modify revenue growth, profit margins, WACC, and other essential metrics.
- Real-Time Calculations: Automatic updates reveal results immediately as adjustments are made.
- Professional-Grade Template: A polished Excel file crafted for investment-ready valuation.
- Adaptable and Repeatable: Designed for versatility, suitable for ongoing detailed forecasts.
Core Features
- Customizable Forecast Inputs: Adjust essential variables such as premium growth, loss ratios, and operational expenses.
- Instant DCF Valuation: Quickly computes intrinsic value, NPV, and other key metrics.
- High-Precision Accuracy: Leverages Lifenet Insurance Company’s real-world data for dependable valuation results.
- Simplified Scenario Analysis: Easily experiment with various assumptions and assess outcomes side by side.
- Efficiency Booster: Streamlines the process, eliminating the need to create intricate valuation models from the ground up.
How It Works
- Step 1: Download the Excel file for Lifenet Insurance Company (7157T).
- Step 2: Examine the pre-filled financial data and projections for Lifenet.
- Step 3: Adjust key inputs such as revenue growth, WACC, and tax rates (highlighted cells).
- Step 4: Observe the DCF model update in real-time as you modify assumptions.
- Step 5: Evaluate the outputs and leverage the results for your investment strategies.
Why Opt for Lifenet Insurance Company's Calculator?
- Effortless Setup: Skip the hassle of building a DCF model from scratch – it’s ready for immediate use.
- Enhanced Precision: Dependable financial data and formulas minimize valuation errors.
- Completely Customizable: Adjust the model to align with your unique assumptions and projections.
- User-Friendly Insights: Intuitive charts and outputs simplify result interpretation and analysis.
- Endorsed by Professionals: Crafted for experts who prioritize accuracy and functionality.
Who Can Benefit from Lifenet Insurance Company (7157T)?
- Investors: Make informed choices with our advanced valuation tool tailored for insurance products.
- Financial Analysts: Streamline your workflow with our customizable DCF model designed specifically for insurance analysis.
- Consultants: Effortlessly modify the template for impactful client presentations and comprehensive reports.
- Insurance Enthusiasts: Enhance your knowledge of valuation methodologies through practical, real-world scenarios.
- Educators and Students: Utilize our resources as a valuable learning tool in insurance and finance courses.
What the Template Includes
- In-Depth DCF Model: Editable framework featuring comprehensive valuation calculations.
- Real-World Data: Lifenet Insurance Company’s (7157T) historical and forecasted financials preloaded for analysis.
- Adjustable Parameters: Modify WACC, growth rates, and tax assumptions to explore different scenarios.
- Financial Statements: Complete annual and quarterly breakdowns for enhanced insights.
- Key Financial Ratios: Integrated analysis of profitability, efficiency, and leverage metrics.
- Interactive Dashboard with Visual Outputs: Graphs and tables for clear, actionable insights.
Disclaimer
All information, articles, and product details provided on this website are for general informational and educational purposes only. We do not claim any ownership over, nor do we intend to infringe upon, any trademarks, copyrights, logos, brand names, or other intellectual property mentioned or depicted on this site. Such intellectual property remains the property of its respective owners, and any references here are made solely for identification or informational purposes, without implying any affiliation, endorsement, or partnership.
We make no representations or warranties, express or implied, regarding the accuracy, completeness, or suitability of any content or products presented. Nothing on this website should be construed as legal, tax, investment, financial, medical, or other professional advice. In addition, no part of this site—including articles or product references—constitutes a solicitation, recommendation, endorsement, advertisement, or offer to buy or sell any securities, franchises, or other financial instruments, particularly in jurisdictions where such activity would be unlawful.
All content is of a general nature and may not address the specific circumstances of any individual or entity. It is not a substitute for professional advice or services. Any actions you take based on the information provided here are strictly at your own risk. You accept full responsibility for any decisions or outcomes arising from your use of this website and agree to release us from any liability in connection with your use of, or reliance upon, the content or products found herein.