
|
Mebuki Financial Group, Inc. (7167.T) Valoración de DCF |
Completamente Editable: Adáptelo A Sus Necesidades En Excel O Sheets
Diseño Profesional: Plantillas Confiables Y Estándares De La Industria
Predeterminadas Para Un Uso Rápido Y Eficiente
Compatible con MAC / PC, completamente desbloqueado
No Se Necesita Experiencia; Fáciles De Seguir
Mebuki Financial Group, Inc. (7167.T) Bundle
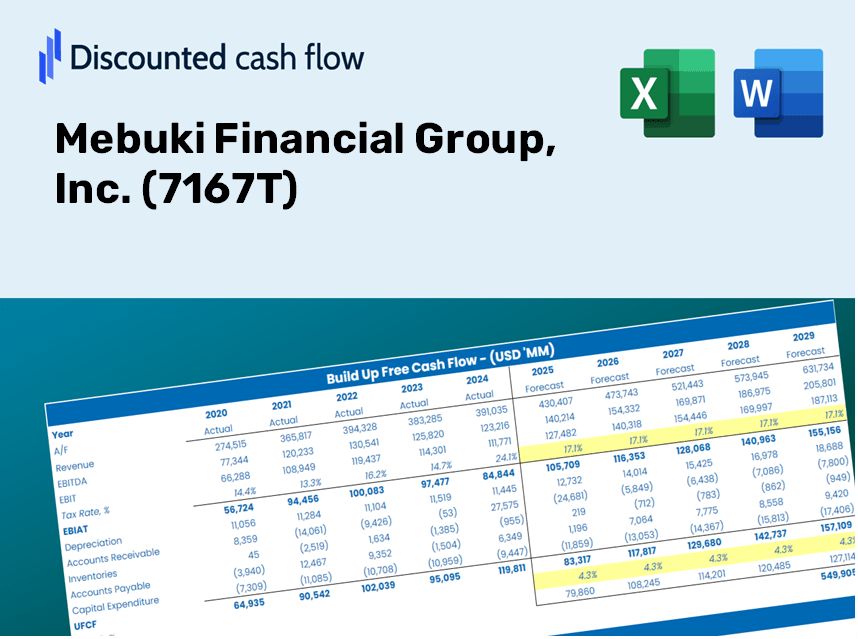
¡Descubra el verdadero valor de Mebuki Financial Group, Inc. (7167T) con nuestra calculadora DCF avanzada! Ajuste los supuestos clave, explore varios escenarios y evalúe cómo los cambios influyen en la valoración de Mebuki Financial Group, Inc. (7167T), todo dentro de una plantilla de Excel conveniente.
Discounted Cash Flow (DCF) - (USD MM)
| Year | AY1 2020 |
AY2 2021 |
AY3 2022 |
AY4 2023 |
AY5 2024 |
FY1 2025 |
FY2 2026 |
FY3 2027 |
FY4 2028 |
FY5 2029 |
|---|---|---|---|---|---|---|---|---|---|---|
| Revenue | 225,636.0 | 253,852.0 | 292,977.0 | 294,175.0 | 343,919.0 | 382,813.0 | 426,105.5 | 474,293.9 | 527,932.1 | 587,636.1 |
| Revenue Growth, % | 0 | 12.51 | 15.41 | 0.40891 | 16.91 | 11.31 | 11.31 | 11.31 | 11.31 | 11.31 |
| EBITDA | 53,852.0 | 70,285.0 | 55,068.0 | .0 | 91,145.0 | 74,152.4 | 82,538.4 | 91,872.7 | 102,262.6 | 113,827.5 |
| EBITDA, % | 23.87 | 27.69 | 18.8 | 0 | 26.5 | 19.37 | 19.37 | 19.37 | 19.37 | 19.37 |
| Depreciation | .0 | 9,531.0 | 9,113.0 | 9,278.0 | 9,355.0 | 9,753.4 | 10,856.4 | 12,084.1 | 13,450.7 | 14,971.9 |
| Depreciation, % | 0 | 3.75 | 3.11 | 3.15 | 2.72 | 2.55 | 2.55 | 2.55 | 2.55 | 2.55 |
| EBIT | 53,852.0 | 60,754.0 | 45,955.0 | -9,278.0 | 81,790.0 | 64,399.1 | 71,682.0 | 79,788.6 | 88,811.9 | 98,855.7 |
| EBIT, % | 23.87 | 23.93 | 15.69 | -3.15 | 23.78 | 16.82 | 16.82 | 16.82 | 16.82 | 16.82 |
| Total Cash | 6,425,755.0 | 7,270,668.0 | 4,818,749.0 | 4,438,860.0 | 3,230,771.0 | 382,813.0 | 426,105.5 | 474,293.9 | 527,932.1 | 587,636.1 |
| Total Cash, percent | .0 | .0 | .0 | .0 | .0 | .0 | .0 | .0 | .0 | .0 |
| Account Receivables | .0 | .0 | .0 | .0 | .0 | .0 | .0 | .0 | .0 | .0 |
| Account Receivables, % | 0 | 0 | 0 | 0 | 0 | 0 | 0 | 0 | 0 | 0 |
| Inventories | .0 | .0 | .0 | .0 | .0 | .0 | .0 | .0 | .0 | .0 |
| Inventories, % | 0 | 0 | 0 | 0 | 0 | 0 | 0 | 0 | 0 | 0 |
| Accounts Payable | .0 | .0 | .0 | .0 | .0 | .0 | .0 | .0 | .0 | .0 |
| Accounts Payable, % | 0 | 0 | 0 | 0 | 0 | 0 | 0 | 0 | 0 | 0 |
| Capital Expenditure | -7,428.0 | -3,824.0 | -6,003.0 | -5,766.0 | -4,370.0 | -7,716.0 | -8,588.7 | -9,560.0 | -10,641.1 | -11,844.5 |
| Capital Expenditure, % | -3.29 | -1.51 | -2.05 | -1.96 | -1.27 | -2.02 | -2.02 | -2.02 | -2.02 | -2.02 |
| Tax Rate, % | 28.81 | 28.81 | 28.81 | 28.81 | 28.81 | 28.81 | 28.81 | 28.81 | 28.81 | 28.81 |
| EBITAT | 37,633.2 | 42,958.0 | 32,176.0 | -6,504.2 | 58,228.0 | 45,324.4 | 50,450.2 | 56,155.6 | 62,506.3 | 69,575.1 |
| Depreciation | ||||||||||
| Changes in Account Receivables | ||||||||||
| Changes in Inventories | ||||||||||
| Changes in Accounts Payable | ||||||||||
| Capital Expenditure | ||||||||||
| UFCF | 30,205.2 | 48,665.0 | 35,286.0 | -2,992.2 | 63,213.0 | 47,361.7 | 52,717.9 | 58,679.8 | 65,315.9 | 72,702.5 |
| WACC, % | 3.08 | 3.1 | 3.08 | 3.08 | 3.11 | 3.09 | 3.09 | 3.09 | 3.09 | 3.09 |
| PV UFCF | ||||||||||
| SUM PV UFCF | 269,378.5 | |||||||||
| Long Term Growth Rate, % | 2.00 | |||||||||
| Free cash flow (T + 1) | 74,157 | |||||||||
| Terminal Value | 6,804,324 | |||||||||
| Present Terminal Value | 5,843,937 | |||||||||
| Enterprise Value | 6,113,316 | |||||||||
| Net Debt | -1,142,791 | |||||||||
| Equity Value | 7,256,107 | |||||||||
| Diluted Shares Outstanding, MM | 998 | |||||||||
| Equity Value Per Share | 7,274.05 |
Benefits of Choosing Mebuki Financial Group, Inc. (7167T)
- Comprehensive Financial Data: Access both historical and projected financials for precise asset valuation.
- Customizable Parameters: Adjust metrics such as WACC, tax rates, revenue growth, and capital spending as needed.
- Dynamic Calculations: Automatic computation of intrinsic value and NPV for real-time insights.
- Scenario Planning: Analyze various scenarios to assess the future trajectory of Mebuki Financial Group, Inc. (7167T).
- User-Friendly Interface: Designed for industry professionals while remaining approachable for those new to finance.
Key Features
- Real-Life Mebuki Financial Data: Pre-loaded with Mebuki Financial Group, Inc.'s historical financial performance and future projections.
- Fully Customizable Inputs: Tailor revenue growth, profit margins, WACC, tax rates, and capital expenditures to fit your analysis.
- Dynamic Valuation Model: Instant updates to Net Present Value (NPV) and intrinsic value responsive to your adjustments.
- Scenario Analysis: Develop various forecasting scenarios to evaluate different valuation results.
- User-Friendly Interface: Intuitive, organized, and accessible for both seasoned professionals and newcomers.
How It Functions
- Download: Obtain the pre-configured Excel file containing Mebuki Financial Group, Inc.'s (7167T) financial data.
- Customize: Modify forecasts, such as revenue growth, EBITDA percentage, and WACC.
- Automatically Update: The intrinsic value and NPV computations refresh in real-time.
- Test Scenarios: Develop various projections and compare results instantly.
- Make Decisions: Leverage the valuation findings to inform your investment strategy.
Why Select Mebuki Financial Group, Inc. (7167T)?
- Save Time: Jump right in with our pre-built DCF model—no setup required.
- Enhance Accuracy: Dependable financial data and precise formulas minimize valuation errors.
- Completely Customizable: Adjust the model to suit your specific assumptions and forecasts.
- User-Friendly: Intuitive charts and outputs simplify result interpretation.
- Endorsed by Professionals: Crafted for industry experts who prioritize accuracy and functionality.
Who Can Benefit from Mebuki Financial Group, Inc. (7167T)?
- Institutional Investors: Develop in-depth and trustworthy valuation models for investment assessments.
- Corporate Finance Departments: Evaluate valuation scenarios to inform strategic planning.
- Financial Consultants: Deliver precise valuation insights to clients investing in Mebuki Financial Group, Inc. (7167T).
- Academics and Students: Utilize real-time data to enhance financial modeling skills and education.
- Finance Enthusiasts: Gain insights into how financial institutions like Mebuki Financial Group, Inc. (7167T) are valued within the market.
Contents of the Template
- Operating and Balance Sheet Data: Pre-filled historical data and forecasts for Mebuki Financial Group, Inc. (7167T), including revenue, EBITDA, EBIT, and capital expenditures.
- WACC Calculation: A dedicated sheet for Weighted Average Cost of Capital (WACC), featuring parameters such as Beta, risk-free rate, and share price.
- DCF Valuation (Unlevered and Levered): Customizable Discounted Cash Flow models displaying intrinsic value with comprehensive calculations.
- Financial Statements: Pre-loaded annual and quarterly financial statements to facilitate in-depth analysis.
- Key Ratios: Includes profitability, leverage, and efficiency ratios specific to Mebuki Financial Group, Inc. (7167T).
- Dashboard and Charts: Visual representation of valuation outputs and assumptions for easy result analysis.
Disclaimer
All information, articles, and product details provided on this website are for general informational and educational purposes only. We do not claim any ownership over, nor do we intend to infringe upon, any trademarks, copyrights, logos, brand names, or other intellectual property mentioned or depicted on this site. Such intellectual property remains the property of its respective owners, and any references here are made solely for identification or informational purposes, without implying any affiliation, endorsement, or partnership.
We make no representations or warranties, express or implied, regarding the accuracy, completeness, or suitability of any content or products presented. Nothing on this website should be construed as legal, tax, investment, financial, medical, or other professional advice. In addition, no part of this site—including articles or product references—constitutes a solicitation, recommendation, endorsement, advertisement, or offer to buy or sell any securities, franchises, or other financial instruments, particularly in jurisdictions where such activity would be unlawful.
All content is of a general nature and may not address the specific circumstances of any individual or entity. It is not a substitute for professional advice or services. Any actions you take based on the information provided here are strictly at your own risk. You accept full responsibility for any decisions or outcomes arising from your use of this website and agree to release us from any liability in connection with your use of, or reliance upon, the content or products found herein.