
|
Kyushu Financial Group, Inc. (7180.T) Valoración de DCF |
Completamente Editable: Adáptelo A Sus Necesidades En Excel O Sheets
Diseño Profesional: Plantillas Confiables Y Estándares De La Industria
Predeterminadas Para Un Uso Rápido Y Eficiente
Compatible con MAC / PC, completamente desbloqueado
No Se Necesita Experiencia; Fáciles De Seguir
Kyushu Financial Group, Inc. (7180.T) Bundle
¿Busca determinar el valor intrínseco de Kyushu Financial Group, Inc.? Nuestra calculadora DCF (7180T) integra datos del mundo real con extensas características de personalización, lo que le permite refinar sus pronósticos y mejorar sus estrategias de inversión.
Discounted Cash Flow (DCF) - (USD MM)
| Year | AY1 2020 |
AY2 2021 |
AY3 2022 |
AY4 2023 |
AY5 2024 |
FY1 2025 |
FY2 2026 |
FY3 2027 |
FY4 2028 |
FY5 2029 |
|---|---|---|---|---|---|---|---|---|---|---|
| Revenue | 172,110.0 | 178,615.0 | 205,640.0 | 212,540.0 | 217,971.0 | 231,496.4 | 245,861.0 | 261,117.1 | 277,319.7 | 294,527.8 |
| Revenue Growth, % | 0 | 3.78 | 15.13 | 3.36 | 2.56 | 6.21 | 6.21 | 6.21 | 6.21 | 6.21 |
| EBITDA | 29,501.0 | 32,097.0 | 44,264.0 | 47,218.0 | 52,485.0 | 47,656.2 | 50,613.3 | 53,753.9 | 57,089.4 | 60,631.9 |
| EBITDA, % | 17.14 | 17.97 | 21.52 | 22.22 | 24.08 | 20.59 | 20.59 | 20.59 | 20.59 | 20.59 |
| Depreciation | 8,102.0 | 8,396.0 | 8,798.0 | 9,327.0 | 9,705.0 | 10,429.9 | 11,077.1 | 11,764.5 | 12,494.5 | 13,269.8 |
| Depreciation, % | 4.71 | 4.7 | 4.28 | 4.39 | 4.45 | 4.51 | 4.51 | 4.51 | 4.51 | 4.51 |
| EBIT | 21,399.0 | 23,701.0 | 35,466.0 | 37,891.0 | 42,780.0 | 37,226.2 | 39,536.2 | 41,989.4 | 44,594.9 | 47,362.1 |
| EBIT, % | 12.43 | 13.27 | 17.25 | 17.83 | 19.63 | 16.08 | 16.08 | 16.08 | 16.08 | 16.08 |
| Total Cash | 1,960,030.0 | 3,613,159.0 | 2,227,327.0 | 2,212,538.0 | 1,890,214.0 | 231,496.4 | 245,861.0 | 261,117.1 | 277,319.7 | 294,527.8 |
| Total Cash, percent | .0 | .0 | .0 | .0 | .0 | .0 | .0 | .0 | .0 | .0 |
| Account Receivables | .0 | .0 | .0 | .0 | .0 | .0 | .0 | .0 | .0 | .0 |
| Account Receivables, % | 0 | 0 | 0 | 0 | 0 | 0 | 0 | 0 | 0 | 0 |
| Inventories | .0 | .0 | .0 | .0 | .0 | .0 | .0 | .0 | .0 | .0 |
| Inventories, % | 0 | 0 | 0 | 0 | 0 | 0 | 0 | 0 | 0 | 0 |
| Accounts Payable | .0 | .0 | .0 | .0 | .0 | .0 | .0 | .0 | .0 | .0 |
| Accounts Payable, % | 0 | 0 | 0 | 0 | 0 | 0 | 0 | 0 | 0 | 0 |
| Capital Expenditure | -6,945.0 | -14,425.0 | -7,664.0 | -10,030.0 | -11,300.0 | -11,918.1 | -12,657.6 | -13,443.1 | -14,277.2 | -15,163.1 |
| Capital Expenditure, % | -4.04 | -8.08 | -3.73 | -4.72 | -5.18 | -5.15 | -5.15 | -5.15 | -5.15 | -5.15 |
| Tax Rate, % | 29.02 | 29.02 | 29.02 | 29.02 | 29.02 | 29.02 | 29.02 | 29.02 | 29.02 | 29.02 |
| EBITAT | 15,012.0 | 16,696.6 | 24,714.0 | 26,350.2 | 30,367.0 | 26,118.6 | 27,739.3 | 29,460.6 | 31,288.6 | 33,230.1 |
| Depreciation | ||||||||||
| Changes in Account Receivables | ||||||||||
| Changes in Inventories | ||||||||||
| Changes in Accounts Payable | ||||||||||
| Capital Expenditure | ||||||||||
| UFCF | 16,169.0 | 10,667.6 | 25,848.0 | 25,647.2 | 28,772.0 | 24,630.4 | 26,158.8 | 27,782.0 | 29,505.9 | 31,336.8 |
| WACC, % | 2.86 | 2.86 | 2.84 | 2.84 | 2.88 | 2.86 | 2.86 | 2.86 | 2.86 | 2.86 |
| PV UFCF | ||||||||||
| SUM PV UFCF | 127,786.8 | |||||||||
| Long Term Growth Rate, % | 2.00 | |||||||||
| Free cash flow (T + 1) | 31,964 | |||||||||
| Terminal Value | 3,732,640 | |||||||||
| Present Terminal Value | 3,242,359 | |||||||||
| Enterprise Value | 3,370,146 | |||||||||
| Net Debt | -315,135 | |||||||||
| Equity Value | 3,685,281 | |||||||||
| Diluted Shares Outstanding, MM | 433 | |||||||||
| Equity Value Per Share | 8,518.22 |
What You Will Receive
- Editable Excel Template: A fully adjustable Excel-based DCF Calculator featuring pre-populated financial data for Kyushu Financial Group, Inc. (7180T).
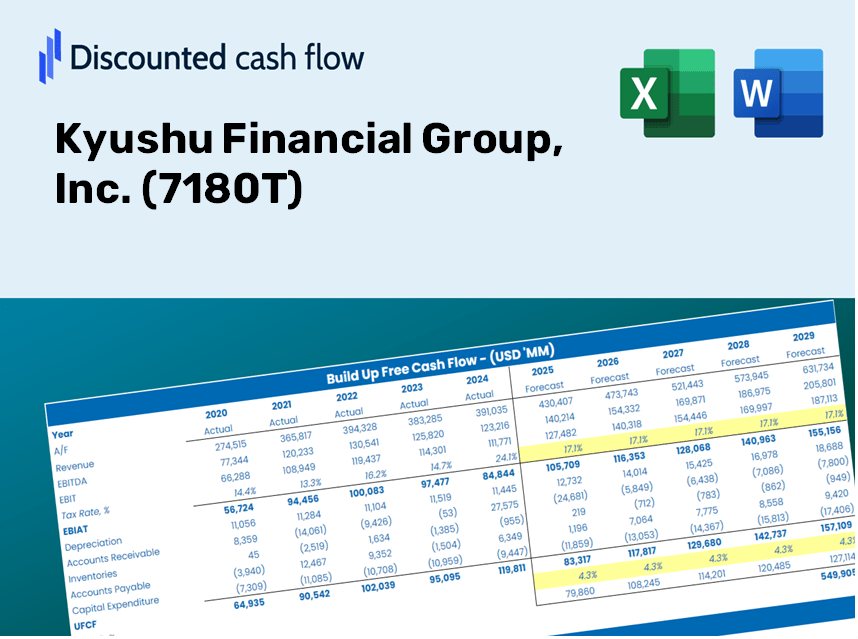
- Real-World Data: Access to historical data and forward-looking projections (highlighted in the yellow cells).
- Forecast Flexibility: Modify assumptions regarding revenue growth, EBITDA %, and WACC with ease.
- Automatic Calculations: Quickly observe how your inputs affect the valuation of Kyushu Financial Group, Inc. (7180T).
- Professional Tool: Designed for use by investors, CFOs, consultants, and financial analysts.
- User-Friendly Design: Organized for clarity and convenience, complete with step-by-step guidance.
Key Features
- Real-Time KYF Data: Pre-loaded with Kyushu Financial Group’s historical financial metrics and future projections.
- Fully Customizable Parameters: Modify revenue growth rates, profit margins, cost of capital, tax rates, and capital spending.
- Dynamic Valuation Framework: Instant updates to Net Present Value (NPV) and intrinsic value based on your adjustments.
- Scenario Analysis: Develop multiple forecast scenarios to evaluate various valuation possibilities.
- User-Centric Interface: Intuitive and organized, suitable for both experienced professionals and newcomers.
How It Works
- Step 1: Download the Excel file.
- Step 2: Review Kyushu Financial Group, Inc.’s pre-filled financial data and projections.
- Step 3: Adjust key inputs such as revenue growth, WACC, and tax rates (marked cells).
- Step 4: Observe the DCF model update in real-time as you modify your assumptions.
- Step 5: Evaluate the outputs and leverage the findings for your investment strategies.
Why Opt for the Kyushu Financial Group, Inc. Calculator?
- Time-Efficient: Skip the hassle of building a DCF model from scratch – it's instantly accessible.
- Enhanced Accuracy: Dependable financial data and formulas minimize valuation errors.
- Completely Customizable: Adjust the model to suit your unique assumptions and forecasts.
- User-Friendly: Intuitive charts and outputs simplify the analysis of results.
- Endorsed by Professionals: Crafted for experts who prioritize accuracy and functionality.
Who Can Benefit from Kyushu Financial Group, Inc. (7180T)?
- Finance Students: Master valuation methodologies and apply them with actual financial data.
- Researchers: Utilize industry-standard models for academic projects and studies.
- Investors: Evaluate your own hypotheses and investigate valuation scenarios for Kyushu Financial Group, Inc. (7180T).
- Financial Analysts: Enhance your processes with a ready-to-use, adaptable DCF model.
- Entrepreneurs: Discover how major firms like Kyushu Financial Group, Inc. (7180T) undergo financial analysis.
Components of the Template
- Pre-Filled DCF Model: Kyushu Financial Group, Inc. (7180T)'s financial data preloaded for immediate use.
- WACC Calculator: Comprehensive calculations for Weighted Average Cost of Capital.
- Financial Ratios: Assess Kyushu’s profitability, leverage, and operational efficiency.
- Editable Inputs: Modify assumptions such as growth, margins, and CAPEX to align with your scenarios.
- Financial Statements: Access annual and quarterly reports for in-depth analysis.
- Interactive Dashboard: Effortlessly visualize key valuation metrics and outcomes.
Disclaimer
All information, articles, and product details provided on this website are for general informational and educational purposes only. We do not claim any ownership over, nor do we intend to infringe upon, any trademarks, copyrights, logos, brand names, or other intellectual property mentioned or depicted on this site. Such intellectual property remains the property of its respective owners, and any references here are made solely for identification or informational purposes, without implying any affiliation, endorsement, or partnership.
We make no representations or warranties, express or implied, regarding the accuracy, completeness, or suitability of any content or products presented. Nothing on this website should be construed as legal, tax, investment, financial, medical, or other professional advice. In addition, no part of this site—including articles or product references—constitutes a solicitation, recommendation, endorsement, advertisement, or offer to buy or sell any securities, franchises, or other financial instruments, particularly in jurisdictions where such activity would be unlawful.
All content is of a general nature and may not address the specific circumstances of any individual or entity. It is not a substitute for professional advice or services. Any actions you take based on the information provided here are strictly at your own risk. You accept full responsibility for any decisions or outcomes arising from your use of this website and agree to release us from any liability in connection with your use of, or reliance upon, the content or products found herein.