
|
Aeon Hokkaido Corporation (7512.T) Valoración de DCF |
Completamente Editable: Adáptelo A Sus Necesidades En Excel O Sheets
Diseño Profesional: Plantillas Confiables Y Estándares De La Industria
Predeterminadas Para Un Uso Rápido Y Eficiente
Compatible con MAC / PC, completamente desbloqueado
No Se Necesita Experiencia; Fáciles De Seguir
Aeon Hokkaido Corporation (7512.T) Bundle
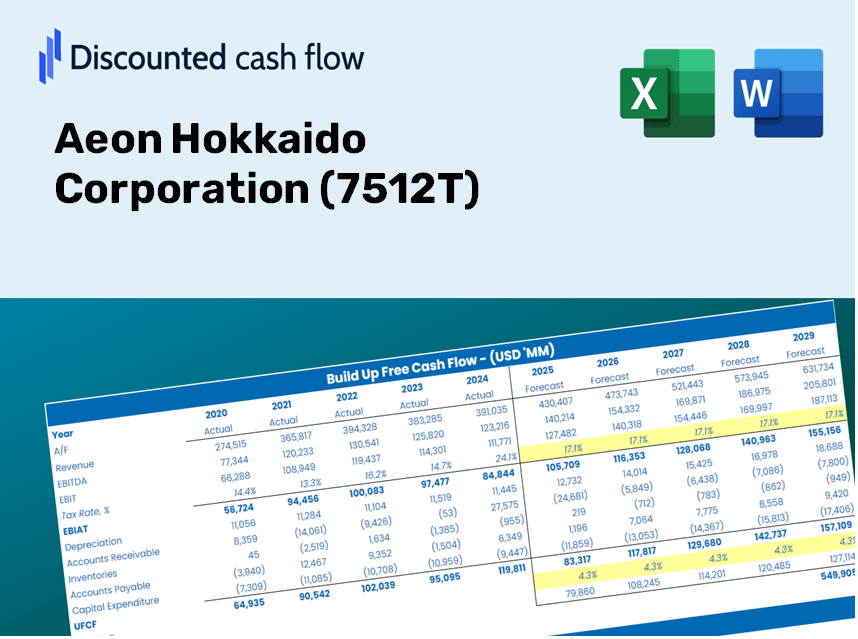
Diseñada para la precisión, nuestra calculadora DCF (7512T) le permite evaluar la valoración de Aeon Hokkaido Corporation utilizando datos financieros reales, ofreciendo una flexibilidad completa para modificar todos los parámetros esenciales para los pronósticos mejorados.
Discounted Cash Flow (DCF) - (USD MM)
| Year | AY1 2020 |
AY2 2021 |
AY3 2022 |
AY4 2023 |
AY5 2024 |
FY1 2025 |
FY2 2026 |
FY3 2027 |
FY4 2028 |
FY5 2029 |
|---|---|---|---|---|---|---|---|---|---|---|
| Revenue | 338,456.0 | 340,796.0 | 339,659.0 | 356,008.0 | 377,482.0 | 388,054.3 | 398,922.7 | 410,095.6 | 421,581.3 | 433,388.7 |
| Revenue Growth, % | 0 | 0.69137 | -0.33363 | 4.81 | 6.03 | 2.8 | 2.8 | 2.8 | 2.8 | 2.8 |
| EBITDA | 13,637.0 | 11,099.0 | 13,320.0 | 15,088.0 | 12,306.0 | 14,517.6 | 14,924.2 | 15,342.2 | 15,771.9 | 16,213.7 |
| EBITDA, % | 4.03 | 3.26 | 3.92 | 4.24 | 3.26 | 3.74 | 3.74 | 3.74 | 3.74 | 3.74 |
| Depreciation | 5,406.0 | 5,814.0 | 6,164.0 | 6,340.0 | 7,048.0 | 6,803.4 | 6,993.9 | 7,189.8 | 7,391.2 | 7,598.2 |
| Depreciation, % | 1.6 | 1.71 | 1.81 | 1.78 | 1.87 | 1.75 | 1.75 | 1.75 | 1.75 | 1.75 |
| EBIT | 8,231.0 | 5,285.0 | 7,156.0 | 8,748.0 | 5,258.0 | 7,714.3 | 7,930.3 | 8,152.4 | 8,380.8 | 8,615.5 |
| EBIT, % | 2.43 | 1.55 | 2.11 | 2.46 | 1.39 | 1.99 | 1.99 | 1.99 | 1.99 | 1.99 |
| Total Cash | 6,302.0 | 3,771.0 | 3,904.0 | 3,838.0 | 4,370.0 | 4,931.1 | 5,069.2 | 5,211.2 | 5,357.1 | 5,507.2 |
| Total Cash, percent | .0 | .0 | .0 | .0 | .0 | .0 | .0 | .0 | .0 | .0 |
| Account Receivables | 9,531.0 | 9,909.0 | 10,009.0 | 10,886.0 | 12,738.0 | 11,721.3 | 12,049.6 | 12,387.1 | 12,734.0 | 13,090.7 |
| Account Receivables, % | 2.82 | 2.91 | 2.95 | 3.06 | 3.37 | 3.02 | 3.02 | 3.02 | 3.02 | 3.02 |
| Inventories | 18,037.0 | 17,806.0 | 18,057.0 | 17,924.0 | 19,140.0 | 20,159.7 | 20,724.4 | 21,304.8 | 21,901.5 | 22,514.9 |
| Inventories, % | 5.33 | 5.22 | 5.32 | 5.03 | 5.07 | 5.2 | 5.2 | 5.2 | 5.2 | 5.2 |
| Accounts Payable | 29,283.0 | 25,387.0 | 24,579.0 | 25,544.0 | 29,944.0 | 29,837.7 | 30,673.4 | 31,532.5 | 32,415.7 | 33,323.5 |
| Accounts Payable, % | 8.65 | 7.45 | 7.24 | 7.18 | 7.93 | 7.69 | 7.69 | 7.69 | 7.69 | 7.69 |
| Capital Expenditure | -6,777.0 | -13,661.0 | -8,694.0 | -8,185.0 | -17,806.0 | -12,096.9 | -12,435.7 | -12,784.0 | -13,142.1 | -13,510.2 |
| Capital Expenditure, % | -2 | -4.01 | -2.56 | -2.3 | -4.72 | -3.12 | -3.12 | -3.12 | -3.12 | -3.12 |
| Tax Rate, % | 28.44 | 28.44 | 28.44 | 28.44 | 28.44 | 28.44 | 28.44 | 28.44 | 28.44 | 28.44 |
| EBITAT | 5,935.7 | 3,906.1 | 4,775.7 | 6,274.0 | 3,762.7 | 5,493.2 | 5,647.1 | 5,805.2 | 5,967.8 | 6,134.9 |
| Depreciation | ||||||||||
| Changes in Account Receivables | ||||||||||
| Changes in Inventories | ||||||||||
| Changes in Accounts Payable | ||||||||||
| Capital Expenditure | ||||||||||
| UFCF | 6,279.7 | -7,983.9 | 1,086.7 | 4,650.0 | -5,663.3 | 90.3 | 148.0 | 152.1 | 156.4 | 160.8 |
| WACC, % | 4.14 | 4.16 | 4.09 | 4.14 | 4.14 | 4.13 | 4.13 | 4.13 | 4.13 | 4.13 |
| PV UFCF | ||||||||||
| SUM PV UFCF | 622.2 | |||||||||
| Long Term Growth Rate, % | 3.50 | |||||||||
| Free cash flow (T + 1) | 166 | |||||||||
| Terminal Value | 26,298 | |||||||||
| Present Terminal Value | 21,478 | |||||||||
| Enterprise Value | 22,100 | |||||||||
| Net Debt | 42,071 | |||||||||
| Equity Value | -19,971 | |||||||||
| Diluted Shares Outstanding, MM | 139 | |||||||||
| Equity Value Per Share | -143.25 |
Benefits of Using Our Model
- Flexible Input Options: Effortlessly modify key variables (growth %, margins, WACC) to explore different scenarios.
- Pre-Filled Data: Utilize Aeon Hokkaido Corporation's (7512T) financial information to kickstart your analysis.
- Instant DCF Calculations: Automatically compute Net Present Value (NPV) and intrinsic value with our template.
- Professional-Grade and Adaptable: A sleek Excel model that fits your valuation requirements.
- Designed for Analysts and Investors: Perfect for evaluating projections, affirming strategies, and saving valuable time.
Key Features
- 🔍 Real-Life (7512T) Financials: Access pre-filled historical and projected data for Aeon Hokkaido Corporation.
- ✏️ Fully Customizable Inputs: Modify all essential parameters (yellow cells) such as WACC, growth %, and tax rates.
- 📊 Professional DCF Valuation: Integrated formulas calculate Aeon Hokkaido's intrinsic value using the Discounted Cash Flow method.
- ⚡ Instant Results: View Aeon Hokkaido's valuation immediately after making adjustments.
- Scenario Analysis: Explore and compare different outcomes based on various financial assumptions side-by-side.
How It Works
- Step 1: Download the prebuilt Excel template featuring Aeon Hokkaido Corporation's (7512T) data.
- Step 2: Review the pre-filled sheets to familiarize yourself with the essential metrics.
- Step 3: Modify forecasts and assumptions in the editable yellow cells (WACC, growth, margins).
- Step 4: Instantly see recalculated results, including the intrinsic value of Aeon Hokkaido Corporation (7512T).
- Step 5: Use the outputs to make informed investment decisions or create reports.
Why Choose This Calculator for Aeon Hokkaido Corporation (7512T)?
- Reliable Data: Access accurate Aeon Hokkaido Corporation financial information for trustworthy valuation outcomes.
- Flexible Customization: Tailor essential metrics such as growth rates, WACC, and tax rates to fit your financial forecasts.
- Effortless Efficiency: Ready-to-use calculations save you time and eliminate the hassle of starting from the beginning.
- Expert-Level Tool: Crafted for investors, analysts, and consultants focusing on Aeon Hokkaido Corporation.
- Intuitive Design: User-friendly interface and clear instructions ensure accessibility for everyone.
Who Can Benefit from This Product?
- Professional Investors: Develop comprehensive and trustworthy valuation models for portfolio assessment of Aeon Hokkaido Corporation (7512T).
- Corporate Finance Teams: Evaluate valuation scenarios to inform strategic decisions within the company.
- Consultants and Advisors: Deliver precise valuation insights for clients interested in Aeon Hokkaido Corporation (7512T).
- Students and Educators: Utilize real-world data to enhance financial modeling skills and knowledge.
- Retail Industry Enthusiasts: Gain insights into how retail companies like Aeon Hokkaido Corporation (7512T) are valued in the marketplace.
What the Template Contains
- Operating and Balance Sheet Data: Pre-filled Aeon Hokkaido Corporation (7512T) historical data and forecasts, including revenue, EBITDA, EBIT, and capital expenditures.
- WACC Calculation: A dedicated sheet for Weighted Average Cost of Capital (WACC), featuring parameters such as Beta, risk-free rate, and share price.
- DCF Valuation (Unlevered and Levered): Editable Discounted Cash Flow models that illustrate intrinsic value with comprehensive calculations.
- Financial Statements: Pre-loaded financial statements (annual and quarterly) to facilitate analysis.
- Key Ratios: Includes profitability, leverage, and efficiency ratios specific to Aeon Hokkaido Corporation (7512T).
- Dashboard and Charts: A visual summary of valuation outputs and assumptions for easy result analysis.
Disclaimer
All information, articles, and product details provided on this website are for general informational and educational purposes only. We do not claim any ownership over, nor do we intend to infringe upon, any trademarks, copyrights, logos, brand names, or other intellectual property mentioned or depicted on this site. Such intellectual property remains the property of its respective owners, and any references here are made solely for identification or informational purposes, without implying any affiliation, endorsement, or partnership.
We make no representations or warranties, express or implied, regarding the accuracy, completeness, or suitability of any content or products presented. Nothing on this website should be construed as legal, tax, investment, financial, medical, or other professional advice. In addition, no part of this site—including articles or product references—constitutes a solicitation, recommendation, endorsement, advertisement, or offer to buy or sell any securities, franchises, or other financial instruments, particularly in jurisdictions where such activity would be unlawful.
All content is of a general nature and may not address the specific circumstances of any individual or entity. It is not a substitute for professional advice or services. Any actions you take based on the information provided here are strictly at your own risk. You accept full responsibility for any decisions or outcomes arising from your use of this website and agree to release us from any liability in connection with your use of, or reliance upon, the content or products found herein.