
|
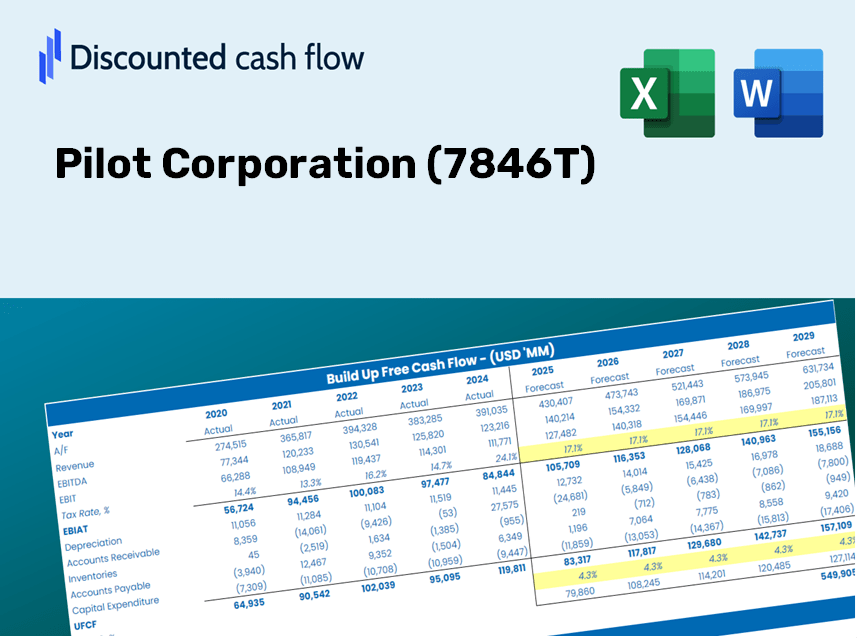
Pilot Corporation (7846.T) Valoración de DCF |
Completamente Editable: Adáptelo A Sus Necesidades En Excel O Sheets
Diseño Profesional: Plantillas Confiables Y Estándares De La Industria
Predeterminadas Para Un Uso Rápido Y Eficiente
Compatible con MAC / PC, completamente desbloqueado
No Se Necesita Experiencia; Fáciles De Seguir
Pilot Corporation (7846.T) Bundle
Diseñada para la precisión, nuestra calculadora DCF (7846T) le permite evaluar la valoración de la corporación piloto utilizando datos financieros del mundo real, ofreciendo una flexibilidad completa para modificar todos los parámetros clave para las proyecciones mejoradas.
Discounted Cash Flow (DCF) - (USD MM)
| Year | AY1 2020 |
AY2 2021 |
AY3 2022 |
AY4 2023 |
AY5 2024 |
FY1 2025 |
FY2 2026 |
FY3 2027 |
FY4 2028 |
FY5 2029 |
|---|---|---|---|---|---|---|---|---|---|---|
| Revenue | 87,096.0 | 103,057.0 | 112,850.0 | 118,590.0 | 126,168.0 | 138,565.5 | 152,181.2 | 167,134.8 | 183,557.8 | 201,594.5 |
| Revenue Growth, % | 0 | 18.33 | 9.5 | 5.09 | 6.39 | 9.83 | 9.83 | 9.83 | 9.83 | 9.83 |
| EBITDA | 18,473.0 | 24,287.0 | 26,570.0 | 25,098.0 | 22,928.0 | 29,835.2 | 32,766.8 | 35,986.6 | 39,522.7 | 43,406.2 |
| EBITDA, % | 21.21 | 23.57 | 23.54 | 21.16 | 18.17 | 21.53 | 21.53 | 21.53 | 21.53 | 21.53 |
| Depreciation | 4,007.0 | 3,679.0 | 3,822.0 | 4,657.0 | 5,122.0 | 5,416.2 | 5,948.5 | 6,533.0 | 7,174.9 | 7,879.9 |
| Depreciation, % | 4.6 | 3.57 | 3.39 | 3.93 | 4.06 | 3.91 | 3.91 | 3.91 | 3.91 | 3.91 |
| EBIT | 14,466.0 | 20,608.0 | 22,748.0 | 20,441.0 | 17,806.0 | 24,418.9 | 26,818.4 | 29,453.6 | 32,347.8 | 35,526.3 |
| EBIT, % | 16.61 | 20 | 20.16 | 17.24 | 14.11 | 17.62 | 17.62 | 17.62 | 17.62 | 17.62 |
| Total Cash | 38,313.0 | 46,515.0 | 46,128.0 | 39,171.0 | 39,977.0 | 53,961.9 | 59,264.3 | 65,087.7 | 71,483.4 | 78,507.5 |
| Total Cash, percent | .0 | .0 | .0 | .0 | .0 | .0 | .0 | .0 | .0 | .0 |
| Account Receivables | 18,657.0 | 22,459.0 | 22,654.0 | 24,157.0 | 25,645.0 | 28,817.4 | 31,649.0 | 34,758.9 | 38,174.4 | 41,925.5 |
| Account Receivables, % | 21.42 | 21.79 | 20.07 | 20.37 | 20.33 | 20.8 | 20.8 | 20.8 | 20.8 | 20.8 |
| Inventories | 22,285.0 | 25,920.0 | 32,834.0 | 37,295.0 | 37,010.0 | 38,969.0 | 42,798.1 | 47,003.6 | 51,622.2 | 56,694.7 |
| Inventories, % | 25.59 | 25.15 | 29.1 | 31.45 | 29.33 | 28.12 | 28.12 | 28.12 | 28.12 | 28.12 |
| Accounts Payable | 9,690.0 | 14,161.0 | 14,354.0 | 12,148.0 | 11,197.0 | 15,714.6 | 17,258.7 | 18,954.6 | 20,817.1 | 22,862.6 |
| Accounts Payable, % | 11.13 | 13.74 | 12.72 | 10.24 | 8.87 | 11.34 | 11.34 | 11.34 | 11.34 | 11.34 |
| Capital Expenditure | -5,054.0 | -3,575.0 | -4,513.0 | -9,287.0 | -11,192.0 | -8,306.4 | -9,122.6 | -10,019.0 | -11,003.5 | -12,084.7 |
| Capital Expenditure, % | -5.8 | -3.47 | -4 | -7.83 | -8.87 | -5.99 | -5.99 | -5.99 | -5.99 | -5.99 |
| Tax Rate, % | 29 | 29 | 29 | 29 | 29 | 29 | 29 | 29 | 29 | 29 |
| EBITAT | 10,032.2 | 14,344.5 | 15,849.6 | 13,797.3 | 12,641.5 | 16,952.9 | 18,618.7 | 20,448.2 | 22,457.5 | 24,664.2 |
| Depreciation | ||||||||||
| Changes in Account Receivables | ||||||||||
| Changes in Inventories | ||||||||||
| Changes in Accounts Payable | ||||||||||
| Capital Expenditure | ||||||||||
| UFCF | -22,266.8 | 11,482.5 | 8,242.6 | 997.3 | 4,417.5 | 13,449.0 | 10,327.9 | 11,342.7 | 12,457.3 | 13,681.3 |
| WACC, % | 4.72 | 4.72 | 4.72 | 4.72 | 4.72 | 4.72 | 4.72 | 4.72 | 4.72 | 4.72 |
| PV UFCF | ||||||||||
| SUM PV UFCF | 53,363.2 | |||||||||
| Long Term Growth Rate, % | 1.00 | |||||||||
| Free cash flow (T + 1) | 13,818 | |||||||||
| Terminal Value | 371,656 | |||||||||
| Present Terminal Value | 295,144 | |||||||||
| Enterprise Value | 348,507 | |||||||||
| Net Debt | -39,122 | |||||||||
| Equity Value | 387,629 | |||||||||
| Diluted Shares Outstanding, MM | 39 | |||||||||
| Equity Value Per Share | 9,920.39 |
What You Will Receive
- Authentic PCL Financial Data: Pre-loaded with Pilot Corporation's historical and forecasted data for accurate analysis.
- Completely Customizable Template: Easily adjust key parameters such as revenue growth, WACC, and EBITDA %.
- Instant Calculations: View updates to Pilot Corporation’s intrinsic value immediately based on your modifications.
- Expert Valuation Tool: Crafted for investors, analysts, and consultants aiming for precise DCF outcomes.
- Intuitive Design: Streamlined layout and straightforward instructions suitable for all skill levels.
Key Features
- Real Pilot Corporation Financials: Gain access to precise pre-loaded historical data and future forecasts.
- Customizable Forecast Assumptions: Modify the yellow-highlighted fields such as WACC, growth rates, and profit margins.
- Dynamic Calculations: Automatic updates for DCF, Net Present Value (NPV), and cash flow evaluations.
- Visual Dashboard: User-friendly charts and summaries to effectively visualize your valuation outcomes.
- Suitable for All Skill Levels: An easy-to-navigate structure designed for investors, CFOs, and consultants alike.
How It Functions
- 1. Access the Template: Download and open the Excel file containing Pilot Corporation’s (7846T) preloaded data.
- 2. Modify Assumptions: Adjust essential inputs such as growth rates, WACC, and capital expenditures.
- 3. Instant Results: The DCF model automatically calculates the intrinsic value and NPV in real-time.
- 4. Explore Scenarios: Evaluate various forecasts to investigate different valuation scenarios.
- 5. Present with Assurance: Share professional valuation insights to back your strategic decisions.
Why Opt for This Calculator for Pilot Corporation (7846T)?
- Time-Saving: Avoid the hassle of building a DCF model from the ground up – it's ready for immediate use.
- Enhanced Accuracy: Dependable financial data and formulas help minimize valuation errors.
- Completely Customizable: Adjust the model to align with your specific assumptions and future projections.
- User-Friendly: Intuitive charts and outputs facilitate straightforward analysis of results.
- Endorsed by Professionals: Crafted for experts who prioritize both precision and usability.
Who Can Benefit from This Product?
- Professional Investors: Create comprehensive and trustworthy valuation models for portfolio assessment related to Pilot Corporation (7846T).
- Corporate Finance Teams: Evaluate valuation scenarios to inform strategic decisions within the organization.
- Consultants and Advisors: Deliver precise valuation insights for clients focusing on Pilot Corporation (7846T).
- Students and Educators: Utilize real-world data to enhance financial modeling skills in academic settings.
- Tech Enthusiasts: Gain insight into how technology companies like Pilot Corporation (7846T) are evaluated in the financial market.
Contents of the Template
- Operating and Balance Sheet Data: Pre-filled historical data and forecasts for Pilot Corporation (7846T), including revenue, EBITDA, EBIT, and capital expenditures.
- WACC Calculation: A specific sheet for the Weighted Average Cost of Capital (WACC), detailing parameters such as Beta, risk-free rate, and share price.
- DCF Valuation (Unlevered and Levered): Customizable Discounted Cash Flow models exhibiting intrinsic value along with comprehensive calculations.
- Financial Statements: Pre-loaded financial statements (annual and quarterly) to facilitate thorough analysis.
- Key Ratios: Features profitability, leverage, and efficiency ratios specific to Pilot Corporation (7846T).
- Dashboard and Charts: Visual representation of valuation outputs and underlying assumptions for simplified result analysis.
Disclaimer
All information, articles, and product details provided on this website are for general informational and educational purposes only. We do not claim any ownership over, nor do we intend to infringe upon, any trademarks, copyrights, logos, brand names, or other intellectual property mentioned or depicted on this site. Such intellectual property remains the property of its respective owners, and any references here are made solely for identification or informational purposes, without implying any affiliation, endorsement, or partnership.
We make no representations or warranties, express or implied, regarding the accuracy, completeness, or suitability of any content or products presented. Nothing on this website should be construed as legal, tax, investment, financial, medical, or other professional advice. In addition, no part of this site—including articles or product references—constitutes a solicitation, recommendation, endorsement, advertisement, or offer to buy or sell any securities, franchises, or other financial instruments, particularly in jurisdictions where such activity would be unlawful.
All content is of a general nature and may not address the specific circumstances of any individual or entity. It is not a substitute for professional advice or services. Any actions you take based on the information provided here are strictly at your own risk. You accept full responsibility for any decisions or outcomes arising from your use of this website and agree to release us from any liability in connection with your use of, or reliance upon, the content or products found herein.