
|
FP Corporation (7947.T) Valoración de DCF |
Completamente Editable: Adáptelo A Sus Necesidades En Excel O Sheets
Diseño Profesional: Plantillas Confiables Y Estándares De La Industria
Predeterminadas Para Un Uso Rápido Y Eficiente
Compatible con MAC / PC, completamente desbloqueado
No Se Necesita Experiencia; Fáciles De Seguir
FP Corporation (7947.T) Bundle
¡Obtenga información sobre su análisis de valoración de FP Corporation (7947T) con nuestra sofisticada calculadora DCF! Esta plantilla de Excel viene precargada con datos reales (7947T), lo que le permite ajustar los pronósticos y los supuestos para determinar con precisión el valor intrínseco de FP Corporation.
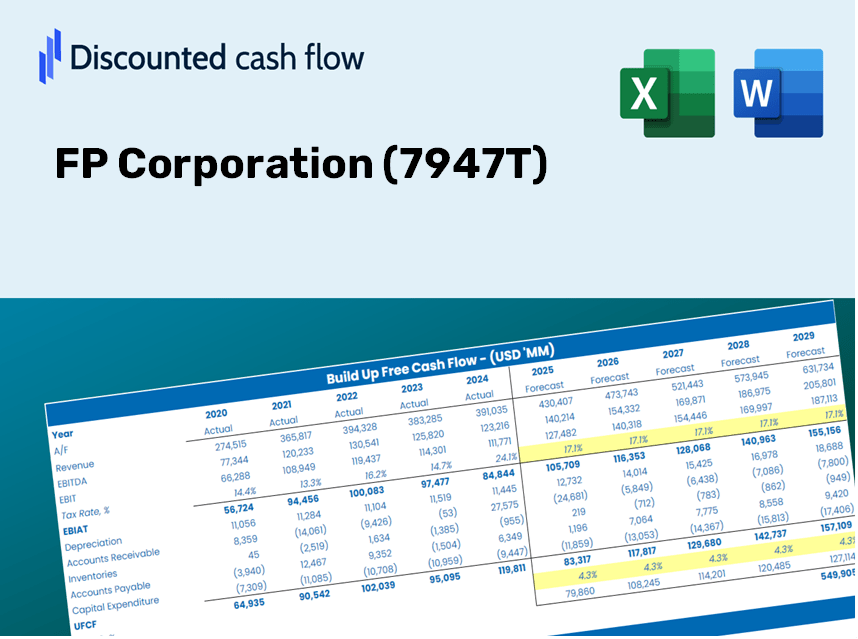
Discounted Cash Flow (DCF) - (USD MM)
| Year | AY1 2020 |
AY2 2021 |
AY3 2022 |
AY4 2023 |
AY5 2024 |
FY1 2025 |
FY2 2026 |
FY3 2027 |
FY4 2028 |
FY5 2029 |
|---|---|---|---|---|---|---|---|---|---|---|
| Revenue | 196,950.0 | 195,700.0 | 211,285.0 | 222,100.0 | 235,628.0 | 246,548.6 | 257,975.3 | 269,931.6 | 282,442.0 | 295,532.3 |
| Revenue Growth, % | 0 | -0.63468 | 7.96 | 5.12 | 6.09 | 4.63 | 4.63 | 4.63 | 4.63 | 4.63 |
| EBITDA | 31,751.0 | 30,163.0 | 31,247.0 | 32,193.0 | 33,236.0 | 36,944.5 | 38,656.8 | 40,448.4 | 42,323.0 | 44,284.5 |
| EBITDA, % | 16.12 | 15.41 | 14.79 | 14.49 | 14.11 | 14.98 | 14.98 | 14.98 | 14.98 | 14.98 |
| Depreciation | 13,609.0 | 13,636.0 | 14,180.0 | 15,052.0 | 14,751.0 | 16,581.1 | 17,349.6 | 18,153.7 | 18,995.0 | 19,875.4 |
| Depreciation, % | 6.91 | 6.97 | 6.71 | 6.78 | 6.26 | 6.73 | 6.73 | 6.73 | 6.73 | 6.73 |
| EBIT | 18,142.0 | 16,527.0 | 17,067.0 | 17,141.0 | 18,485.0 | 20,363.4 | 21,307.2 | 22,294.7 | 23,328.0 | 24,409.2 |
| EBIT, % | 9.21 | 8.45 | 8.08 | 7.72 | 7.84 | 8.26 | 8.26 | 8.26 | 8.26 | 8.26 |
| Total Cash | 17,884.0 | 19,745.0 | 22,255.0 | 23,707.0 | 19,020.0 | 23,890.1 | 24,997.4 | 26,155.9 | 27,368.1 | 28,636.6 |
| Total Cash, percent | .0 | .0 | .0 | .0 | .0 | .0 | .0 | .0 | .0 | .0 |
| Account Receivables | 39,748.0 | 42,787.0 | 48,627.0 | 52,150.0 | 47,288.0 | 53,555.1 | 56,037.2 | 58,634.3 | 61,351.8 | 64,195.3 |
| Account Receivables, % | 20.18 | 21.86 | 23.01 | 23.48 | 20.07 | 21.72 | 21.72 | 21.72 | 21.72 | 21.72 |
| Inventories | 22,395.0 | 24,279.0 | 29,854.0 | 28,905.0 | 31,683.0 | 31,739.4 | 33,210.4 | 34,749.6 | 36,360.2 | 38,045.3 |
| Inventories, % | 11.37 | 12.41 | 14.13 | 13.01 | 13.45 | 12.87 | 12.87 | 12.87 | 12.87 | 12.87 |
| Accounts Payable | 21,184.0 | 23,881.0 | 26,530.0 | 28,893.0 | 28,055.0 | 29,798.3 | 31,179.3 | 32,624.4 | 34,136.4 | 35,718.5 |
| Accounts Payable, % | 10.76 | 12.2 | 12.56 | 13.01 | 11.91 | 12.09 | 12.09 | 12.09 | 12.09 | 12.09 |
| Capital Expenditure | -17,709.0 | -23,546.0 | -28,343.0 | -11,800.0 | -14,828.0 | -22,704.1 | -23,756.3 | -24,857.3 | -26,009.4 | -27,214.8 |
| Capital Expenditure, % | -8.99 | -12.03 | -13.41 | -5.31 | -6.29 | -9.21 | -9.21 | -9.21 | -9.21 | -9.21 |
| Tax Rate, % | 31.71 | 31.71 | 31.71 | 31.71 | 31.71 | 31.71 | 31.71 | 31.71 | 31.71 | 31.71 |
| EBITAT | 12,266.4 | 11,253.0 | 11,622.3 | 11,832.4 | 12,622.9 | 13,892.6 | 14,536.5 | 15,210.2 | 15,915.1 | 16,652.8 |
| Depreciation | ||||||||||
| Changes in Account Receivables | ||||||||||
| Changes in Inventories | ||||||||||
| Changes in Accounts Payable | ||||||||||
| Capital Expenditure | ||||||||||
| UFCF | -32,792.6 | -883.0 | -11,306.7 | 14,873.4 | 13,791.9 | 3,189.4 | 5,557.7 | 5,815.3 | 6,084.8 | 6,366.8 |
| WACC, % | 4.04 | 4.05 | 4.05 | 4.06 | 4.05 | 4.05 | 4.05 | 4.05 | 4.05 | 4.05 |
| PV UFCF | ||||||||||
| SUM PV UFCF | 23,772.7 | |||||||||
| Long Term Growth Rate, % | 2.00 | |||||||||
| Free cash flow (T + 1) | 6,494 | |||||||||
| Terminal Value | 316,773 | |||||||||
| Present Terminal Value | 259,739 | |||||||||
| Enterprise Value | 283,511 | |||||||||
| Net Debt | 61,493 | |||||||||
| Equity Value | 222,018 | |||||||||
| Diluted Shares Outstanding, MM | 81 | |||||||||
| Equity Value Per Share | 2,746.33 |
Benefits You Will Receive
- Customizable Excel Template: A fully adjustable Excel-based DCF Calculator featuring pre-populated financial data for FP Corporation (7947T).
- Accurate Data: Access to historical performance data and forecast estimates (highlighted in the yellow cells).
- Adjustable Projections: Modify key assumptions such as revenue growth, EBITDA percentage, and WACC.
- Instant Calculations: Quickly observe how your inputs influence FP Corporation’s valuation.
- Professional-Grade Tool: Designed for investors, CFOs, consultants, and financial analysts.
- User-Friendly Interface: Organized for straightforward navigation with comprehensive step-by-step guidance.
Key Features
- 🔍 Real-Life FP Corporation Financials: Pre-filled historical and projected data for FP Corporation (7947T).
- ✏️ Fully Customizable Inputs: Modify all essential parameters (yellow cells) such as WACC, growth %, and tax rates.
- 📊 Professional DCF Valuation: Integrated formulas compute FP Corporation’s intrinsic value using the Discounted Cash Flow method.
- ⚡ Instant Results: Immediately visualize FP Corporation’s valuation after implementing changes.
- Scenario Analysis: Assess and compare results for different financial assumptions side-by-side.
How It Works
- 1. Open the Template: Download and access the Excel file preloaded with FP Corporation (7947T) data.
- 2. Edit Assumptions: Adjust key variables such as growth rates, WACC, and capital expenditures.
- 3. View Results Instantly: The DCF model automatically computes intrinsic value and NPV.
- 4. Test Scenarios: Explore various forecasts to evaluate different valuation scenarios.
- 5. Use with Confidence: Provide professional valuation insights to inform your decisions.
Why Opt for FP Corporation (7947T) Calculator?
- Precision: Utilizes real FP Corporation financial data for reliable insights.
- Versatility: Crafted for users to easily experiment with and adjust inputs.
- Efficiency: Eliminate the need to create a DCF model from the ground up.
- High-Caliber: Built with the accuracy and usability standards expected by CFOs.
- Intuitive: Simple to navigate, catering to users with varying levels of financial expertise.
Who Can Benefit from FP Corporation (7947T)?
- Professional Investors: Develop comprehensive and trustworthy valuation models for portfolio management.
- Corporate Finance Teams: Assess valuation scenarios to inform strategic decision-making.
- Consultants and Advisors: Equip clients with precise valuation insights for FP Corporation (7947T).
- Students and Educators: Leverage real-world data to enhance learning and practice in financial modeling.
- Tech Enthusiasts: Gain insights into the valuation processes of technology companies like FP Corporation (7947T).
Contents of the Template
- Pre-Filled DCF Model: FP Corporation’s financial data preloaded for immediate analysis.
- WACC Calculator: Comprehensive calculations for Weighted Average Cost of Capital.
- Financial Ratios: Assess FP Corporation’s profitability, leverage, and operational efficiency.
- Editable Inputs: Modify assumptions such as growth rates, margins, and CAPEX to tailor to your scenarios.
- Financial Statements: Annual and quarterly reports available for thorough examination.
- Interactive Dashboard: Seamlessly visualize key valuation metrics and outcomes.
Disclaimer
All information, articles, and product details provided on this website are for general informational and educational purposes only. We do not claim any ownership over, nor do we intend to infringe upon, any trademarks, copyrights, logos, brand names, or other intellectual property mentioned or depicted on this site. Such intellectual property remains the property of its respective owners, and any references here are made solely for identification or informational purposes, without implying any affiliation, endorsement, or partnership.
We make no representations or warranties, express or implied, regarding the accuracy, completeness, or suitability of any content or products presented. Nothing on this website should be construed as legal, tax, investment, financial, medical, or other professional advice. In addition, no part of this site—including articles or product references—constitutes a solicitation, recommendation, endorsement, advertisement, or offer to buy or sell any securities, franchises, or other financial instruments, particularly in jurisdictions where such activity would be unlawful.
All content is of a general nature and may not address the specific circumstances of any individual or entity. It is not a substitute for professional advice or services. Any actions you take based on the information provided here are strictly at your own risk. You accept full responsibility for any decisions or outcomes arising from your use of this website and agree to release us from any liability in connection with your use of, or reliance upon, the content or products found herein.