
|
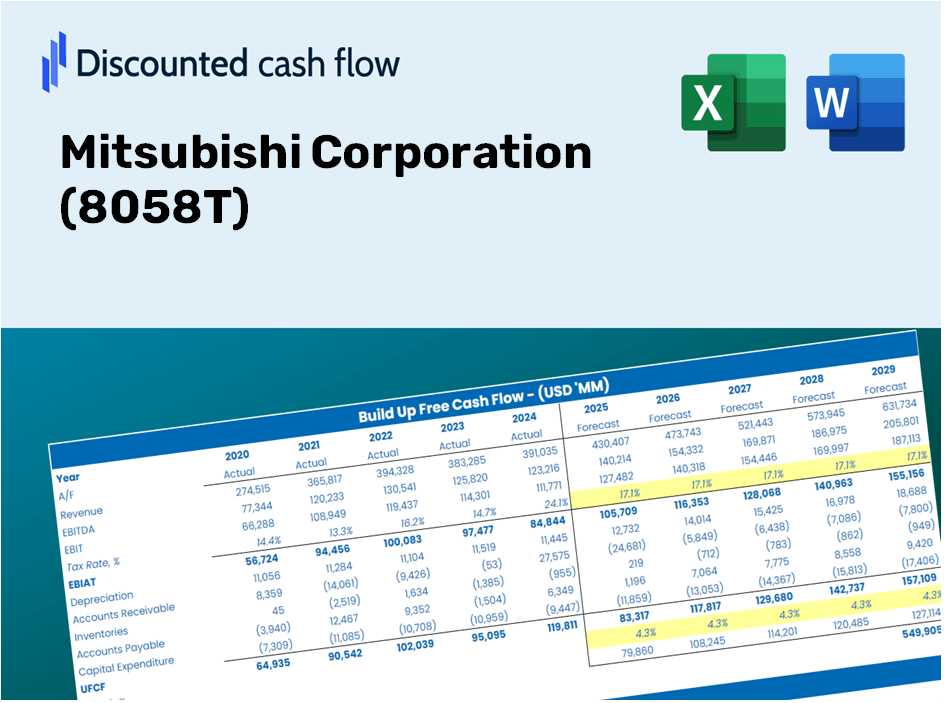
Mitsubishi Corporation (8058.T) Valoración de DCF |
Completamente Editable: Adáptelo A Sus Necesidades En Excel O Sheets
Diseño Profesional: Plantillas Confiables Y Estándares De La Industria
Predeterminadas Para Un Uso Rápido Y Eficiente
Compatible con MAC / PC, completamente desbloqueado
No Se Necesita Experiencia; Fáciles De Seguir
Mitsubishi Corporation (8058.T) Bundle
¡Evalúe las perspectivas financieras de Mitsubishi Corporation como un experto! Esta calculadora DCF (8058T) proporciona datos financieros preconsados y ofrece flexibilidad total para modificar el crecimiento de los ingresos, WACC, los márgenes y otros supuestos esenciales para alinearse con sus proyecciones.
Discounted Cash Flow (DCF) - (USD MM)
| Year | AY1 2021 |
AY2 2022 |
AY3 2023 |
AY4 2024 |
AY5 2025 |
FY1 2026 |
FY2 2027 |
FY3 2028 |
FY4 2029 |
FY5 2030 |
|---|---|---|---|---|---|---|---|---|---|---|
| Revenue | 12,884,521.0 | 17,264,828.0 | 21,571,973.0 | 19,567,601.0 | 18,617,601.0 | 18,756,245.0 | 18,895,921.5 | 19,036,638.1 | 19,178,402.6 | 19,321,222.9 |
| Revenue Growth, % | 0 | 34 | 24.95 | -9.29 | -4.85 | 0.74469 | 0.74469 | 0.74469 | 0.74469 | 0.74469 |
| EBITDA | 687,640.0 | 1,452,657.0 | 1,687,629.0 | 1,479,331.0 | 1,413,616.0 | 1,377,727.5 | 1,387,987.3 | 1,398,323.6 | 1,408,736.8 | 1,419,227.6 |
| EBITDA, % | 5.34 | 8.41 | 7.82 | 7.56 | 7.59 | 7.35 | 7.35 | 7.35 | 7.35 | 7.35 |
| Depreciation | 523,830.0 | 545,043.0 | 583,294.0 | 599,330.0 | 470,768.0 | 582,117.4 | 586,452.4 | 590,819.7 | 595,219.5 | 599,652.0 |
| Depreciation, % | 4.07 | 3.16 | 2.7 | 3.06 | 2.53 | 3.1 | 3.1 | 3.1 | 3.1 | 3.1 |
| EBIT | 163,810.0 | 907,614.0 | 1,104,335.0 | 880,001.0 | 942,848.0 | 795,610.1 | 801,534.9 | 807,503.9 | 813,517.3 | 819,575.5 |
| EBIT, % | 1.27 | 5.26 | 5.12 | 4.5 | 5.06 | 4.24 | 4.24 | 4.24 | 4.24 | 4.24 |
| Total Cash | 1,481,106.0 | 1,710,448.0 | 1,694,417.0 | 1,351,051.0 | 1,645,188.0 | 1,687,999.8 | 1,700,570.2 | 1,713,234.2 | 1,725,992.6 | 1,738,845.9 |
| Total Cash, percent | .0 | .0 | .0 | .0 | .0 | .0 | .0 | .0 | .0 | .0 |
| Account Receivables | 3,269,390.0 | 4,283,171.0 | 4,127,275.0 | 4,242,973.0 | 4,167,850.0 | 4,253,393.6 | 4,285,068.3 | 4,316,978.9 | 4,349,127.2 | 4,381,514.8 |
| Account Receivables, % | 25.37 | 24.81 | 19.13 | 21.68 | 22.39 | 22.68 | 22.68 | 22.68 | 22.68 | 22.68 |
| Inventories | 1,423,043.0 | 1,874,884.0 | 1,881,335.0 | 1,846,779.0 | 1,882,895.0 | 1,882,257.3 | 1,896,274.3 | 1,910,395.8 | 1,924,622.4 | 1,938,954.9 |
| Inventories, % | 11.04 | 10.86 | 8.72 | 9.44 | 10.11 | 10.04 | 10.04 | 10.04 | 10.04 | 10.04 |
| Accounts Payable | 2,665,060.0 | 3,382,112.0 | 3,369,018.0 | 2,848,897.0 | 2,879,696.0 | 3,223,006.8 | 3,247,008.3 | 3,271,188.6 | 3,295,548.9 | 3,320,090.6 |
| Accounts Payable, % | 20.68 | 19.59 | 15.62 | 14.56 | 15.47 | 17.18 | 17.18 | 17.18 | 17.18 | 17.18 |
| Capital Expenditure | -388,981.0 | -393,833.0 | -454,954.0 | -520,542.0 | -384,292.0 | -455,156.7 | -458,546.2 | -461,960.9 | -465,401.1 | -468,867.0 |
| Capital Expenditure, % | -3.02 | -2.28 | -2.11 | -2.66 | -2.06 | -2.43 | -2.43 | -2.43 | -2.43 | -2.43 |
| Tax Rate, % | 31.77 | 31.77 | 31.77 | 31.77 | 31.77 | 31.77 | 31.77 | 31.77 | 31.77 | 31.77 |
| EBITAT | 111,488.8 | 658,034.1 | 775,828.7 | 622,599.9 | 643,288.4 | 556,596.9 | 560,741.8 | 564,917.6 | 569,124.5 | 573,362.7 |
| Depreciation | ||||||||||
| Changes in Account Receivables | ||||||||||
| Changes in Inventories | ||||||||||
| Changes in Accounts Payable | ||||||||||
| Capital Expenditure | ||||||||||
| UFCF | -1,781,035.2 | 60,674.1 | 1,040,519.7 | 100,124.9 | 799,570.4 | 941,962.5 | 666,957.8 | 671,924.5 | 676,928.3 | 681,969.4 |
| WACC, % | 4.96 | 5 | 4.98 | 4.98 | 4.96 | 4.98 | 4.98 | 4.98 | 4.98 | 4.98 |
| PV UFCF | ||||||||||
| SUM PV UFCF | 3,175,734.3 | |||||||||
| Long Term Growth Rate, % | 2.00 | |||||||||
| Free cash flow (T + 1) | 695,609 | |||||||||
| Terminal Value | 23,373,114 | |||||||||
| Present Terminal Value | 18,334,297 | |||||||||
| Enterprise Value | 21,510,032 | |||||||||
| Net Debt | 3,802,678 | |||||||||
| Equity Value | 17,707,354 | |||||||||
| Diluted Shares Outstanding, MM | 4,032 | |||||||||
| Equity Value Per Share | 4,391.91 |
What You Will Receive
- Adjustable Forecast Inputs: Modify key assumptions (growth %, profit margins, WACC) to explore various scenarios.
- Actual Financial Data: Pre-filled financial information for Mitsubishi Corporation (8058T) to kickstart your analysis.
- Automatic DCF Results: The template calculates the Net Present Value (NPV) and intrinsic value seamlessly for you.
- Tailorable and Professional: A refined Excel model that adjusts to your specific valuation requirements.
- Designed for Analysts and Investors: Perfect for evaluating projections, confirming strategies, and enhancing efficiency.
Key Features
- 🔍 Real-Life MITSUBISHI Financials: Pre-filled historical and projected data for Mitsubishi Corporation (8058T).
- ✏️ Fully Customizable Inputs: Modify all essential parameters (yellow cells) such as WACC, growth %, and tax rates.
- 📊 Professional DCF Valuation: Integrated formulas assess Mitsubishi’s intrinsic value using the Discounted Cash Flow method.
- ⚡ Instant Results: Immediately visualize Mitsubishi’s valuation after any adjustments.
- Scenario Analysis: Evaluate and compare potential outcomes for different financial assumptions side-by-side.
How It Operates
- Download: Obtain the pre-formatted Excel file containing Mitsubishi Corporation's (8058T) financial data.
- Customize: Modify forecasts, including revenue growth, EBITDA percentage, and WACC.
- Update Automatically: The intrinsic value and NPV calculations refresh in real-time.
- Test Scenarios: Generate multiple projections and instantly compare the results.
- Make Decisions: Utilize the valuation findings to inform your investment strategy.
Why Opt for This Calculator?
- All-in-One Solution: Features DCF, WACC, and comprehensive financial ratio analyses in a single platform.
- Flexible Inputs: Modify the yellow-highlighted cells to explore different scenarios.
- In-Depth Analytics: Automatically computes Mitsubishi Corporation’s intrinsic value and Net Present Value.
- Built-in Data: Offers historical and projected data for reliable starting points.
- High Professional Standards: Perfect for financial analysts, investors, and business advisors.
Who Can Benefit from This Product?
- Individual Investors: Make well-informed decisions regarding the purchase or sale of Mitsubishi Corporation (8058T) stock.
- Financial Analysts: Enhance your valuation processes with comprehensive financial models tailored for Mitsubishi Corporation (8058T).
- Consultants: Provide clients with accurate and swift valuation insights related to Mitsubishi Corporation (8058T).
- Business Owners: Gain a deeper understanding of how major corporations like Mitsubishi Corporation (8058T) are valued to shape your business strategy.
- Finance Students: Master valuation techniques using real-world data and scenarios focused on Mitsubishi Corporation (8058T).
Contents of the Template
- Preloaded 8058T Data: Historical and projected financial data, covering revenue, EBIT, and capital expenditures.
- DCF and WACC Models: Advanced sheets designed for calculating intrinsic value and Weighted Average Cost of Capital.
- Editable Inputs: Yellow-highlighted cells for modifying revenue growth, tax rates, and discount rates.
- Financial Statements: Detailed annual and quarterly financial statements for in-depth analysis.
- Key Ratios: Ratios for profitability, leverage, and efficiency to assess performance.
- Dashboard and Charts: Visual representations of valuation results and underlying assumptions.
Disclaimer
All information, articles, and product details provided on this website are for general informational and educational purposes only. We do not claim any ownership over, nor do we intend to infringe upon, any trademarks, copyrights, logos, brand names, or other intellectual property mentioned or depicted on this site. Such intellectual property remains the property of its respective owners, and any references here are made solely for identification or informational purposes, without implying any affiliation, endorsement, or partnership.
We make no representations or warranties, express or implied, regarding the accuracy, completeness, or suitability of any content or products presented. Nothing on this website should be construed as legal, tax, investment, financial, medical, or other professional advice. In addition, no part of this site—including articles or product references—constitutes a solicitation, recommendation, endorsement, advertisement, or offer to buy or sell any securities, franchises, or other financial instruments, particularly in jurisdictions where such activity would be unlawful.
All content is of a general nature and may not address the specific circumstances of any individual or entity. It is not a substitute for professional advice or services. Any actions you take based on the information provided here are strictly at your own risk. You accept full responsibility for any decisions or outcomes arising from your use of this website and agree to release us from any liability in connection with your use of, or reliance upon, the content or products found herein.