
|
Inabata & Co., Ltd. (8098.T) Valoración de DCF |
Completamente Editable: Adáptelo A Sus Necesidades En Excel O Sheets
Diseño Profesional: Plantillas Confiables Y Estándares De La Industria
Predeterminadas Para Un Uso Rápido Y Eficiente
Compatible con MAC / PC, completamente desbloqueado
No Se Necesita Experiencia; Fáciles De Seguir
Inabata & Co.,Ltd. (8098.T) Bundle
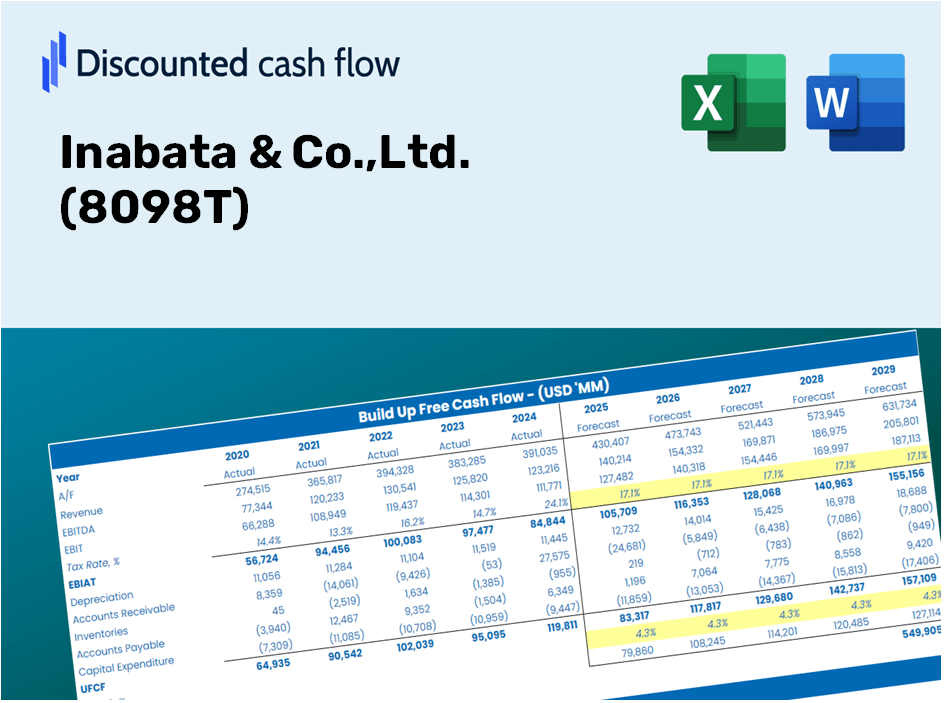
Como inversionista o analista, esta calculadora DCF (8098T) es su recurso de referencia para una valoración precisa. Lleno de datos reales de Inabata & Co., Ltd., puede ajustar los pronósticos y observar instantáneamente los efectos.
Discounted Cash Flow (DCF) - (USD MM)
| Year | AY1 2020 |
AY2 2021 |
AY3 2022 |
AY4 2023 |
AY5 2024 |
FY1 2025 |
FY2 2026 |
FY3 2027 |
FY4 2028 |
FY5 2029 |
|---|---|---|---|---|---|---|---|---|---|---|
| Revenue | 577,583.0 | 680,962.0 | 735,620.0 | 766,022.0 | 837,838.0 | 920,434.5 | 1,011,173.6 | 1,110,858.1 | 1,220,369.7 | 1,340,677.3 |
| Revenue Growth, % | 0 | 17.9 | 8.03 | 4.13 | 9.38 | 9.86 | 9.86 | 9.86 | 9.86 | 9.86 |
| EBITDA | 23,072.0 | 34,293.0 | 32,880.0 | 33,641.0 | 35,067.0 | 40,641.4 | 44,648.0 | 49,049.5 | 53,884.9 | 59,197.1 |
| EBITDA, % | 3.99 | 5.04 | 4.47 | 4.39 | 4.19 | 4.42 | 4.42 | 4.42 | 4.42 | 4.42 |
| Depreciation | 2,876.0 | 3,162.0 | 3,532.0 | 3,743.0 | 4,463.0 | 4,535.4 | 4,982.5 | 5,473.7 | 6,013.3 | 6,606.1 |
| Depreciation, % | 0.49794 | 0.46434 | 0.48014 | 0.48863 | 0.53268 | 0.49275 | 0.49275 | 0.49275 | 0.49275 | 0.49275 |
| EBIT | 20,196.0 | 31,131.0 | 29,348.0 | 29,898.0 | 30,604.0 | 36,106.0 | 39,665.5 | 43,575.8 | 47,871.6 | 52,591.0 |
| EBIT, % | 3.5 | 4.57 | 3.99 | 3.9 | 3.65 | 3.92 | 3.92 | 3.92 | 3.92 | 3.92 |
| Total Cash | 31,462.0 | 35,403.0 | 36,353.0 | 51,310.0 | 59,839.0 | 54,173.6 | 59,514.2 | 65,381.3 | 71,826.8 | 78,907.7 |
| Total Cash, percent | .0 | .0 | .0 | .0 | .0 | .0 | .0 | .0 | .0 | .0 |
| Account Receivables | 162,123.0 | 184,308.0 | 176,505.0 | 205,987.0 | 203,049.0 | 239,781.4 | 263,419.7 | 289,388.4 | 317,917.2 | 349,258.4 |
| Account Receivables, % | 28.07 | 27.07 | 23.99 | 26.89 | 24.23 | 26.05 | 26.05 | 26.05 | 26.05 | 26.05 |
| Inventories | 54,129.0 | 79,064.0 | 88,889.0 | 85,067.0 | 86,730.0 | 100,368.8 | 110,263.4 | 121,133.5 | 133,075.2 | 146,194.2 |
| Inventories, % | 9.37 | 11.61 | 12.08 | 11.11 | 10.35 | 10.9 | 10.9 | 10.9 | 10.9 | 10.9 |
| Accounts Payable | 104,113.0 | 115,959.0 | 105,730.0 | 127,702.0 | 121,191.0 | 148,305.5 | 162,925.9 | 178,987.6 | 196,632.7 | 216,017.4 |
| Accounts Payable, % | 18.03 | 17.03 | 14.37 | 16.67 | 14.46 | 16.11 | 16.11 | 16.11 | 16.11 | 16.11 |
| Capital Expenditure | -2,512.0 | -1,986.0 | -2,950.0 | -4,459.0 | -3,782.0 | -3,978.3 | -4,370.5 | -4,801.3 | -5,274.6 | -5,794.6 |
| Capital Expenditure, % | -0.43492 | -0.29165 | -0.40102 | -0.5821 | -0.4514 | -0.43222 | -0.43222 | -0.43222 | -0.43222 | -0.43222 |
| Tax Rate, % | 31.89 | 31.89 | 31.89 | 31.89 | 31.89 | 31.89 | 31.89 | 31.89 | 31.89 | 31.89 |
| EBITAT | 14,285.0 | 22,847.1 | 20,770.3 | 21,336.7 | 20,845.5 | 25,590.0 | 28,112.7 | 30,884.2 | 33,928.8 | 37,273.6 |
| Depreciation | ||||||||||
| Changes in Account Receivables | ||||||||||
| Changes in Inventories | ||||||||||
| Changes in Accounts Payable | ||||||||||
| Capital Expenditure | ||||||||||
| UFCF | -97,490.0 | -11,250.9 | 9,101.3 | 16,932.7 | 16,290.5 | 2,890.5 | 9,812.2 | 10,779.5 | 11,842.2 | 13,009.6 |
| WACC, % | 4.12 | 4.15 | 4.12 | 4.13 | 4.09 | 4.12 | 4.12 | 4.12 | 4.12 | 4.12 |
| PV UFCF | ||||||||||
| SUM PV UFCF | 42,083.7 | |||||||||
| Long Term Growth Rate, % | 3.00 | |||||||||
| Free cash flow (T + 1) | 13,400 | |||||||||
| Terminal Value | 1,195,727 | |||||||||
| Present Terminal Value | 977,119 | |||||||||
| Enterprise Value | 1,019,203 | |||||||||
| Net Debt | 13,793 | |||||||||
| Equity Value | 1,005,410 | |||||||||
| Diluted Shares Outstanding, MM | 55 | |||||||||
| Equity Value Per Share | 18,446.53 |
Benefits You'll Receive
- Comprehensive Financial Model: Utilize Inabata & Co., Ltd.'s (8098T) actual figures for accurate DCF valuation.
- Complete Forecast Management: Modify revenue growth, profit margins, WACC, and other essential variables.
- Real-Time Calculations: Automatic updates let you view results immediately as you make adjustments.
- Professional-Grade Template: A polished Excel file specifically crafted for high-quality valuation assessments.
- Flexible and Reusable: Designed for versatility, allowing you to perform detailed forecasts repeatedly.
Key Features
- Pre-Loaded Data: Inabata & Co., Ltd.'s historical financial statements and pre-filled forecasts.
- Fully Adjustable Inputs: Modify WACC, tax rates, revenue growth, and EBITDA margins to suit your analysis.
- Instant Results: View Inabata & Co., Ltd.'s intrinsic value recalculated in real time.
- Clear Visual Outputs: Dashboard charts showcase valuation results and essential metrics.
- Built for Accuracy: A professional-grade tool for analysts, investors, and finance professionals.
How It Operates
- 1. Access the Template: Download and open the Excel file containing Inabata & Co., Ltd.’s preloaded data.
- 2. Modify Assumptions: Adjust essential inputs such as growth rates, WACC, and capital expenditures.
- 3. View Results in Real-Time: The DCF model automatically calculates intrinsic value and NPV.
- 4. Explore Scenarios: Evaluate various forecasts to assess different valuation outcomes.
- 5. Present with Assurance: Share professional valuation insights to inform your decisions regarding (8098T).
Why Choose Inabata & Co., Ltd. (8098T) Calculator?
- Precision: Utilize real Inabata financial data for enhanced accuracy.
- Adaptability: Tailored for users to easily adjust and experiment with inputs.
- Efficiency: Eliminate the complexities of constructing a DCF model from the ground up.
- High-Quality: Crafted with the expertise and usability standards expected at the CFO level.
- Intuitive: Simple to navigate, making it accessible to users without extensive financial modeling skills.
Who Can Benefit from Inabata & Co., Ltd. (8098T)?
- Investors: Evaluate Inabata & Co., Ltd.’s (8098T) market performance before making investment decisions.
- CFOs and Financial Analysts: Enhance valuation methodologies and validate financial forecasts.
- Entrepreneurs: Discover how established companies like Inabata & Co., Ltd. (8098T) are appraised.
- Consultants: Create detailed valuation reports for your clients leveraging insights from Inabata & Co., Ltd. (8098T).
- Students and Educators: Utilize authentic data from Inabata & Co., Ltd. (8098T) to master and teach valuation principles.
Contents of the Template
- Historical Data: Includes Inabata & Co., Ltd.'s past financials and baseline forecasts.
- DCF and Levered DCF Models: Comprehensive templates for calculating the intrinsic value of Inabata & Co., Ltd. (8098T).
- WACC Sheet: Pre-formulated calculations for Weighted Average Cost of Capital.
- Editable Inputs: Adjust key drivers such as growth rates, EBITDA %, and CAPEX assumptions.
- Quarterly and Annual Statements: A thorough analysis of Inabata & Co., Ltd.'s financials.
- Interactive Dashboard: Dynamically visualize valuation results and forecasts.
Disclaimer
All information, articles, and product details provided on this website are for general informational and educational purposes only. We do not claim any ownership over, nor do we intend to infringe upon, any trademarks, copyrights, logos, brand names, or other intellectual property mentioned or depicted on this site. Such intellectual property remains the property of its respective owners, and any references here are made solely for identification or informational purposes, without implying any affiliation, endorsement, or partnership.
We make no representations or warranties, express or implied, regarding the accuracy, completeness, or suitability of any content or products presented. Nothing on this website should be construed as legal, tax, investment, financial, medical, or other professional advice. In addition, no part of this site—including articles or product references—constitutes a solicitation, recommendation, endorsement, advertisement, or offer to buy or sell any securities, franchises, or other financial instruments, particularly in jurisdictions where such activity would be unlawful.
All content is of a general nature and may not address the specific circumstances of any individual or entity. It is not a substitute for professional advice or services. Any actions you take based on the information provided here are strictly at your own risk. You accept full responsibility for any decisions or outcomes arising from your use of this website and agree to release us from any liability in connection with your use of, or reliance upon, the content or products found herein.