
|
ITOCHU ENEX Co., Ltd. (8133.T) Valoración de DCF |
Completamente Editable: Adáptelo A Sus Necesidades En Excel O Sheets
Diseño Profesional: Plantillas Confiables Y Estándares De La Industria
Predeterminadas Para Un Uso Rápido Y Eficiente
Compatible con MAC / PC, completamente desbloqueado
No Se Necesita Experiencia; Fáciles De Seguir
Itochu Enex Co.,Ltd. (8133.T) Bundle
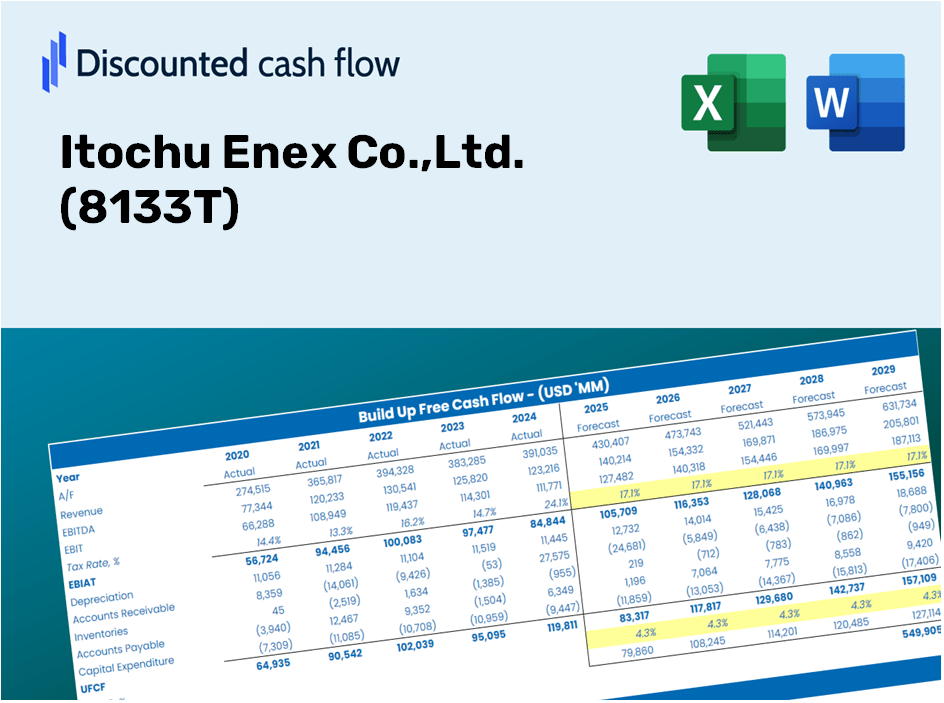
¡Simplifique ITOCHU ENEX Co., Ltd. Valoración con esta calculadora DCF personalizable! Con el Real Itochu Enex Co., Ltd. Financials y las entradas de pronóstico ajustable, puede probar escenarios y descubrir el valor razonable de Itochu Enex Co., Ltd. en minutos.
Discounted Cash Flow (DCF) - (USD MM)
| Year | AY1 2020 |
AY2 2021 |
AY3 2022 |
AY4 2023 |
AY5 2024 |
FY1 2025 |
FY2 2026 |
FY3 2027 |
FY4 2028 |
FY5 2029 |
|---|---|---|---|---|---|---|---|---|---|---|
| Revenue | 739,067.0 | 936,306.0 | 1,012,018.0 | 963,302.0 | 924,481.0 | 906,538.3 | 888,943.8 | 871,690.7 | 854,772.6 | 838,182.8 |
| Revenue Growth, % | 0 | 26.69 | 8.09 | -4.81 | -4.03 | -1.94 | -1.94 | -1.94 | -1.94 | -1.94 |
| EBITDA | 39,313.0 | 41,606.0 | 43,408.0 | 44,083.0 | 48,745.0 | 43,334.5 | 42,493.4 | 41,668.7 | 40,860.0 | 40,067.0 |
| EBITDA, % | 5.32 | 4.44 | 4.29 | 4.58 | 5.27 | 4.78 | 4.78 | 4.78 | 4.78 | 4.78 |
| Depreciation | 19,930.0 | 20,780.0 | 21,873.0 | 20,650.0 | 21,554.0 | 20,945.5 | 20,539.0 | 20,140.4 | 19,749.5 | 19,366.2 |
| Depreciation, % | 2.7 | 2.22 | 2.16 | 2.14 | 2.33 | 2.31 | 2.31 | 2.31 | 2.31 | 2.31 |
| EBIT | 19,383.0 | 20,826.0 | 21,535.0 | 23,433.0 | 27,191.0 | 22,389.0 | 21,954.5 | 21,528.4 | 21,110.5 | 20,700.8 |
| EBIT, % | 2.62 | 2.22 | 2.13 | 2.43 | 2.94 | 2.47 | 2.47 | 2.47 | 2.47 | 2.47 |
| Total Cash | 34,841.0 | 38,145.0 | 32,013.0 | 30,103.0 | 13,931.0 | 30,066.9 | 29,483.3 | 28,911.1 | 28,350.0 | 27,799.7 |
| Total Cash, percent | .0 | .0 | .0 | .0 | .0 | .0 | .0 | .0 | .0 | .0 |
| Account Receivables | 99,764.0 | 118,911.0 | 115,920.0 | 130,006.0 | 117,031.0 | 115,688.7 | 113,443.4 | 111,241.6 | 109,082.6 | 106,965.5 |
| Account Receivables, % | 13.5 | 12.7 | 11.45 | 13.5 | 12.66 | 12.76 | 12.76 | 12.76 | 12.76 | 12.76 |
| Inventories | 25,495.0 | 22,161.0 | 26,176.0 | 28,508.0 | 31,296.0 | 26,738.6 | 26,219.7 | 25,710.8 | 25,211.8 | 24,722.4 |
| Inventories, % | 3.45 | 2.37 | 2.59 | 2.96 | 3.39 | 2.95 | 2.95 | 2.95 | 2.95 | 2.95 |
| Accounts Payable | 97,079.0 | 116,146.0 | 114,818.0 | 119,287.0 | 117,423.0 | 112,356.6 | 110,175.9 | 108,037.6 | 105,940.8 | 103,884.6 |
| Accounts Payable, % | 13.14 | 12.4 | 11.35 | 12.38 | 12.7 | 12.39 | 12.39 | 12.39 | 12.39 | 12.39 |
| Capital Expenditure | -13,264.0 | -12,810.0 | -14,989.0 | -14,367.0 | -12,180.0 | -13,512.6 | -13,250.4 | -12,993.2 | -12,741.0 | -12,493.7 |
| Capital Expenditure, % | -1.79 | -1.37 | -1.48 | -1.49 | -1.32 | -1.49 | -1.49 | -1.49 | -1.49 | -1.49 |
| Tax Rate, % | 35.2 | 35.2 | 35.2 | 35.2 | 35.2 | 35.2 | 35.2 | 35.2 | 35.2 | 35.2 |
| EBITAT | 11,769.7 | 12,354.6 | 12,930.7 | 13,181.6 | 17,618.4 | 13,484.3 | 13,222.6 | 12,966.0 | 12,714.3 | 12,467.5 |
| Depreciation | ||||||||||
| Changes in Account Receivables | ||||||||||
| Changes in Inventories | ||||||||||
| Changes in Accounts Payable | ||||||||||
| Capital Expenditure | ||||||||||
| UFCF | -9,744.3 | 23,578.6 | 17,462.7 | 7,515.6 | 35,315.4 | 21,750.5 | 21,094.8 | 20,685.4 | 20,284.0 | 19,890.3 |
| WACC, % | 4.04 | 4.03 | 4.04 | 4.01 | 4.07 | 4.04 | 4.04 | 4.04 | 4.04 | 4.04 |
| PV UFCF | ||||||||||
| SUM PV UFCF | 92,399.0 | |||||||||
| Long Term Growth Rate, % | 1.00 | |||||||||
| Free cash flow (T + 1) | 20,089 | |||||||||
| Terminal Value | 661,474 | |||||||||
| Present Terminal Value | 542,717 | |||||||||
| Enterprise Value | 635,116 | |||||||||
| Net Debt | 42,723 | |||||||||
| Equity Value | 592,393 | |||||||||
| Diluted Shares Outstanding, MM | 113 | |||||||||
| Equity Value Per Share | 5,252.27 |
What You Will Receive
- Customizable Excel Template: A tailored Excel-based DCF Calculator featuring pre-populated financials for Itochu Enex Co., Ltd. (8133T).
- Real-Time Data: Access to historical data and forward-looking projections (highlighted in the yellow cells).
- Assumption Flexibility: Modify forecast parameters such as revenue growth, EBITDA %, and WACC.
- Instant Calculations: Observe immediate effects of your inputs on the valuation of Itochu Enex Co., Ltd. (8133T).
- Professional Resource: Designed for investors, CFOs, consultants, and financial analysts.
- User-Friendly Interface: Organized for clarity and simplicity, complete with step-by-step guidance.
Key Features
- 🔍 Real-Life Itochu Enex Financials: Pre-filled historical and projected data for Itochu Enex Co., Ltd. (8133T).
- ✏️ Fully Customizable Inputs: Adjust all essential parameters (yellow cells) such as WACC, growth %, and tax rates.
- 📊 Professional DCF Valuation: Integrated formulas calculate the intrinsic value of Itochu Enex using the Discounted Cash Flow method.
- ⚡ Instant Results: Visualize Itochu Enex’s valuation immediately after adjustments are made.
- Scenario Analysis: Evaluate and compare results based on different financial assumptions side-by-side.
How It Works
- Step 1: Download the Excel file for Itochu Enex Co., Ltd. (8133T).
- Step 2: Examine the pre-filled financial data and projections for Itochu Enex.
- Step 3: Adjust key inputs such as revenue growth, WACC, and tax rates (highlighted cells).
- Step 4: Observe the DCF model update in real-time as you modify your assumptions.
- Step 5: Review the outputs and utilize the findings to inform your investment strategies.
Why Opt for the Itochu Enex Co., Ltd. (8133T) Calculator?
- Time Efficiency: Eliminate the hassle of building a DCF model from the ground up – it's ready for immediate use.
- Enhanced Accuracy: Dependable financial data and well-established formulas minimize valuation errors.
- Completely Customizable: Adjust the model to align with your specific assumptions and forecasts.
- User-Friendly: Intuitive charts and outputs simplify the analysis of results.
- Relied Upon by Professionals: Crafted for industry experts who prioritize both precision and ease of use.
Who Should Utilize This Product?
- Professional Investors: Create comprehensive and accurate valuation models for portfolio assessments in Itochu Enex Co., Ltd. (8133T).
- Corporate Finance Teams: Evaluate valuation scenarios to inform strategic decisions within the organization.
- Consultants and Advisors: Deliver precise valuation insights for clients focused on Itochu Enex Co., Ltd. (8133T).
- Students and Educators: Leverage real-life data to enhance financial modeling skills and education.
- Energy Sector Enthusiasts: Gain insight into the valuation processes of companies like Itochu Enex Co., Ltd. (8133T) in the energy market.
Contents of the Template
- Pre-Filled DCF Model: Itochu Enex Co., Ltd.’s financial data preloaded for immediate utilization.
- WACC Calculator: Comprehensive calculations for Weighted Average Cost of Capital.
- Financial Ratios: Assess Itochu Enex Co., Ltd.'s profitability, leverage, and efficiency metrics.
- Editable Inputs: Modify assumptions like growth rates, margins, and CAPEX to suit your needs.
- Financial Statements: Annual and quarterly reports provided for extensive analysis.
- Interactive Dashboard: Effortlessly visualize essential valuation metrics and outcomes.
Disclaimer
All information, articles, and product details provided on this website are for general informational and educational purposes only. We do not claim any ownership over, nor do we intend to infringe upon, any trademarks, copyrights, logos, brand names, or other intellectual property mentioned or depicted on this site. Such intellectual property remains the property of its respective owners, and any references here are made solely for identification or informational purposes, without implying any affiliation, endorsement, or partnership.
We make no representations or warranties, express or implied, regarding the accuracy, completeness, or suitability of any content or products presented. Nothing on this website should be construed as legal, tax, investment, financial, medical, or other professional advice. In addition, no part of this site—including articles or product references—constitutes a solicitation, recommendation, endorsement, advertisement, or offer to buy or sell any securities, franchises, or other financial instruments, particularly in jurisdictions where such activity would be unlawful.
All content is of a general nature and may not address the specific circumstances of any individual or entity. It is not a substitute for professional advice or services. Any actions you take based on the information provided here are strictly at your own risk. You accept full responsibility for any decisions or outcomes arising from your use of this website and agree to release us from any liability in connection with your use of, or reliance upon, the content or products found herein.