
|
Ping, una compañía de seguros de China, Ltd. (82318.HK) Valoración de DCF |
Completamente Editable: Adáptelo A Sus Necesidades En Excel O Sheets
Diseño Profesional: Plantillas Confiables Y Estándares De La Industria
Predeterminadas Para Un Uso Rápido Y Eficiente
Compatible con MAC / PC, completamente desbloqueado
No Se Necesita Experiencia; Fáciles De Seguir
Ping An Insurance (Group) Company of China, Ltd. (82318.HK) Bundle
¡Evalúe Ping An Insurance (Group) Company of China, Ltd. Las perspectivas financieras como un experto! Esta calculadora DCF (82318HK) proporciona finanzas precarias y la libertad de modificar el crecimiento de los ingresos, WACC, los márgenes y otros supuestos cruciales para alinearse con sus proyecciones.
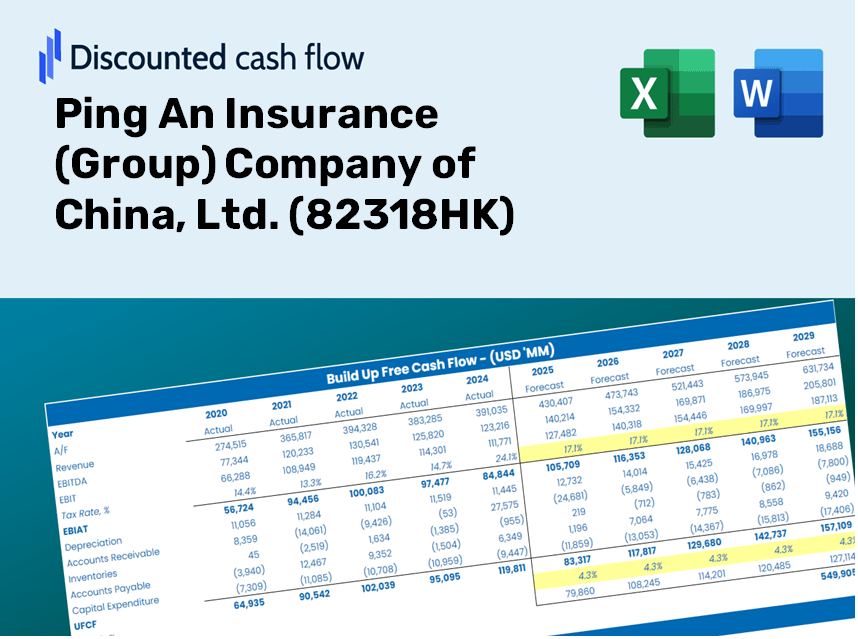
Discounted Cash Flow (DCF) - (USD MM)
| Year | AY1 2020 |
AY2 2021 |
AY3 2022 |
AY4 2023 |
AY5 2024 |
FY1 2025 |
FY2 2026 |
FY3 2027 |
FY4 2028 |
FY5 2029 |
|---|---|---|---|---|---|---|---|---|---|---|
| Revenue | 1,319,899.0 | 1,273,016.0 | 884,643.0 | 906,876.0 | 963,644.0 | 902,724.4 | 845,656.1 | 792,195.5 | 742,114.5 | 695,199.6 |
| Revenue Growth, % | 0 | -3.55 | -30.51 | 2.51 | 6.26 | -6.32 | -6.32 | -6.32 | -6.32 | -6.32 |
| EBITDA | .0 | .0 | .0 | .0 | .0 | .0 | .0 | .0 | .0 | .0 |
| EBITDA, % | 0 | 0 | 0 | 0 | 0 | 0 | 0 | 0 | 0 | 0 |
| Depreciation | .0 | .0 | .0 | .0 | .0 | .0 | .0 | .0 | .0 | .0 |
| Depreciation, % | 0 | 0 | 0 | 0 | 0 | 0 | 0 | 0 | 0 | 0 |
| EBIT | .0 | .0 | .0 | .0 | .0 | .0 | .0 | .0 | .0 | .0 |
| EBIT, % | 0 | 0 | 0 | 0 | 0 | 0 | 0 | 0 | 0 | 0 |
| Total Cash | 597,297.0 | 630,510.0 | 746,516.0 | 797,919.0 | 950,371.0 | 660,390.4 | 618,641.9 | 579,532.6 | 542,895.8 | 508,575.0 |
| Total Cash, percent | .0 | .0 | .0 | .0 | .0 | .0 | .0 | .0 | .0 | .0 |
| Account Receivables | .0 | .0 | .0 | .0 | 246,182.0 | 46,123.8 | 43,207.9 | 40,476.4 | 37,917.6 | 35,520.5 |
| Account Receivables, % | 0 | 0 | 0 | 0 | 25.55 | 5.11 | 5.11 | 5.11 | 5.11 | 5.11 |
| Inventories | .0 | .0 | .0 | .0 | .0 | .0 | .0 | .0 | .0 | .0 |
| Inventories, % | 0 | 0 | 0 | 0 | 0 | 0 | 0 | 0 | 0 | 0 |
| Accounts Payable | 86,233.0 | 103,944.0 | 10,349.0 | 258,766.0 | 6,871.0 | 81,453.1 | 76,303.8 | 71,480.0 | 66,961.2 | 62,728.0 |
| Accounts Payable, % | 6.53 | 8.17 | 1.17 | 28.53 | 0.71302 | 9.02 | 9.02 | 9.02 | 9.02 | 9.02 |
| Capital Expenditure | -9,995.0 | -12,186.0 | -8,871.0 | -7,810.0 | -6,678.0 | -7,711.9 | -7,224.4 | -6,767.7 | -6,339.9 | -5,939.1 |
| Capital Expenditure, % | -0.75725 | -0.95725 | -1 | -0.8612 | -0.69299 | -0.8543 | -0.8543 | -0.8543 | -0.8543 | -0.8543 |
| Tax Rate, % | 25.74 | 25.74 | 25.74 | 25.74 | 25.74 | 25.74 | 25.74 | 25.74 | 25.74 | 25.74 |
| EBITAT | .0 | .0 | .0 | .0 | .0 | .0 | .0 | .0 | .0 | .0 |
| Depreciation | ||||||||||
| Changes in Account Receivables | ||||||||||
| Changes in Inventories | ||||||||||
| Changes in Accounts Payable | ||||||||||
| Capital Expenditure | ||||||||||
| UFCF | 76,238.0 | 5,525.0 | -102,466.0 | 240,607.0 | -504,755.0 | 266,928.3 | -9,457.8 | -8,859.9 | -8,299.8 | -7,775.1 |
| WACC, % | 4.88 | 4.81 | 4.92 | 4.78 | 4.84 | 4.85 | 4.85 | 4.85 | 4.85 | 4.85 |
| PV UFCF | ||||||||||
| SUM PV UFCF | 225,294.8 | |||||||||
| Long Term Growth Rate, % | 2.00 | |||||||||
| Free cash flow (T + 1) | -7,931 | |||||||||
| Terminal Value | -278,686 | |||||||||
| Present Terminal Value | -219,969 | |||||||||
| Enterprise Value | 5,326 | |||||||||
| Net Debt | 445,210 | |||||||||
| Equity Value | -439,884 | |||||||||
| Diluted Shares Outstanding, MM | 18,113 | |||||||||
| Equity Value Per Share | -24.29 |
What You'll Receive
- Adjustable Forecast Inputs: Effortlessly modify key assumptions (growth %, margins, WACC) to explore various scenarios.
- Authentic Financial Data: Pre-filled financial information for Ping An Insurance (Group) Company of China, Ltd. (82318HK) to accelerate your analysis.
- Automated DCF Calculations: The template computes Net Present Value (NPV) and intrinsic value automatically.
- Professional and Customizable: A refined Excel model tailored to fit your valuation requirements.
- Designed for Analysts and Investors: Perfect for evaluating projections, confirming strategies, and enhancing efficiency.
Key Features
- 🔍 Real-Life 82318HK Financials: Pre-filled historical and projected data for Ping An Insurance (Group) Company of China, Ltd.
- ✏️ Fully Customizable Inputs: Modify all essential parameters (yellow cells) such as WACC, growth %, and tax rates.
- 📊 Professional DCF Valuation: Integrated formulas compute Ping An's intrinsic value using the Discounted Cash Flow method.
- ⚡ Instant Results: View Ping An's valuation immediately after making adjustments.
- Scenario Analysis: Evaluate and compare outcomes for different financial assumptions side-by-side.
How It Works
- 1. Access the Template: Download and open the Excel file featuring Ping An Insurance's preloaded data.
- 2. Adjust Assumptions: Modify essential inputs such as growth rates, WACC, and capital expenditures.
- 3. View Results Immediately: The DCF model provides real-time calculations of intrinsic value and NPV.
- 4. Explore Different Scenarios: Evaluate various forecasts to understand different valuation possibilities.
- 5. Present with Assurance: Share professional valuation insights to back your decision-making process.
Reasons to Use This Calculator for Ping An Insurance (Group) Company of China, Ltd. (82318HK)
- All-in-One Solution: Features DCF, WACC, and financial ratio analyses bundled together.
- Flexible Input Options: Modify the yellow-highlighted cells to explore different scenarios.
- In-Depth Analysis: Automatically computes the intrinsic value and Net Present Value for Ping An Insurance.
- Preloaded Information: Access to historical and projected data for reliable baseline calculations.
- Quality for Professionals: Perfect for financial analysts, investors, and business consultants working with Ping An Insurance.
Who Can Benefit from This Product?
- Investors: Make informed choices with a top-tier valuation tool tailored for assessing (82318HK).
- Financial Analysts: Enhance efficiency with a customizable DCF model specifically designed for (82318HK).
- Consultants: Seamlessly modify the template for client reports or presentations related to (82318HK).
- Finance Enthusiasts: Expand your knowledge of valuation methods through practical examples focused on (82318HK).
- Educators and Students: Utilize it as a hands-on resource in finance courses centered around (82318HK).
What the Template Contains
- Historical Data: Includes Ping An's past financial performance and baseline forecasts.
- DCF and Levered DCF Models: Comprehensive templates for calculating Ping An’s intrinsic value.
- WACC Sheet: Pre-defined calculations for Weighted Average Cost of Capital.
- Editable Inputs: Customize essential drivers such as growth rates, EBITDA %, and CAPEX assumptions.
- Quarterly and Annual Statements: A thorough breakdown of Ping An’s financial data.
- Interactive Dashboard: Dynamically visualize valuation results and future projections.
Disclaimer
All information, articles, and product details provided on this website are for general informational and educational purposes only. We do not claim any ownership over, nor do we intend to infringe upon, any trademarks, copyrights, logos, brand names, or other intellectual property mentioned or depicted on this site. Such intellectual property remains the property of its respective owners, and any references here are made solely for identification or informational purposes, without implying any affiliation, endorsement, or partnership.
We make no representations or warranties, express or implied, regarding the accuracy, completeness, or suitability of any content or products presented. Nothing on this website should be construed as legal, tax, investment, financial, medical, or other professional advice. In addition, no part of this site—including articles or product references—constitutes a solicitation, recommendation, endorsement, advertisement, or offer to buy or sell any securities, franchises, or other financial instruments, particularly in jurisdictions where such activity would be unlawful.
All content is of a general nature and may not address the specific circumstances of any individual or entity. It is not a substitute for professional advice or services. Any actions you take based on the information provided here are strictly at your own risk. You accept full responsibility for any decisions or outcomes arising from your use of this website and agree to release us from any liability in connection with your use of, or reliance upon, the content or products found herein.