
|
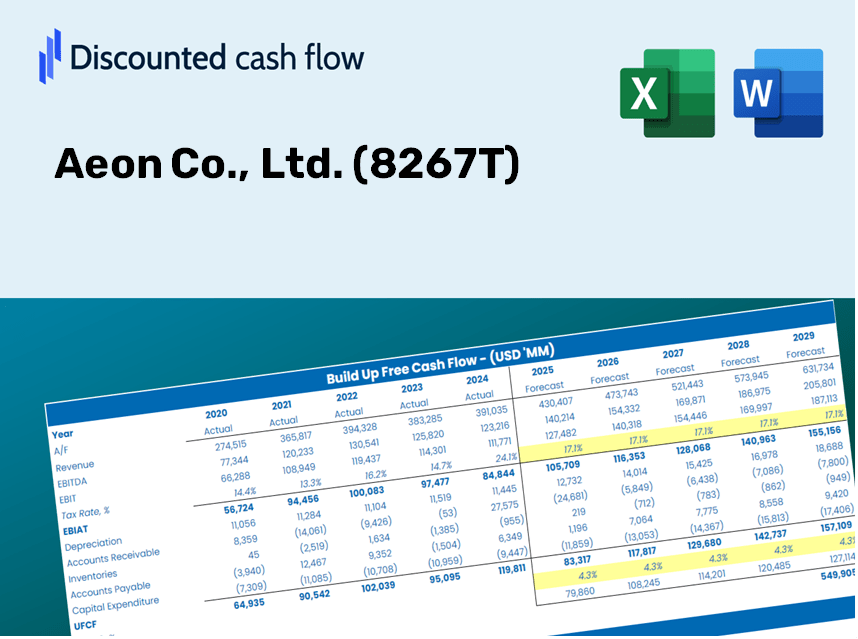
Aeon Co., Ltd. (8267.T) Valoración de DCF |
Completamente Editable: Adáptelo A Sus Necesidades En Excel O Sheets
Diseño Profesional: Plantillas Confiables Y Estándares De La Industria
Predeterminadas Para Un Uso Rápido Y Eficiente
Compatible con MAC / PC, completamente desbloqueado
No Se Necesita Experiencia; Fáciles De Seguir
Aeon Co., Ltd. (8267.T) Bundle
¡Agilice su análisis y aumente la precisión con nuestra calculadora DCF (8267T)! Equipado con datos reales de Aeon Co., Ltd. y suposiciones personalizables, esta herramienta le permite pronosticar, evaluar y valorar Aeon Co., Ltd. como un inversor experimentado.
What You Will Receive
- Pre-Filled Financial Model: Aeon Co., Ltd.'s actual data facilitates accurate DCF valuation.
- Comprehensive Forecast Control: Modify revenue growth, profit margins, WACC, and other vital factors.
- Real-Time Calculations: Automatic updates provide immediate insights as adjustments are made.
- Investor-Grade Template: A polished Excel file crafted for high-level valuation.
- Customizable and Reusable: Designed for adaptability, allowing ongoing use for in-depth forecasts.
Key Features
- Customizable Financial Inputs: Adjust essential factors such as sales growth, operating margin, and capital expenditures.
- Instant DCF Valuation: Quickly computes intrinsic value, net present value (NPV), and additional financial metrics.
- High-Precision Analytics: Leverages Aeon Co., Ltd.'s (8267T) actual financial data for accurate valuation results.
- Effortless Scenario Testing: Easily explore various assumptions and analyze their impacts on outcomes.
- Efficiency Booster: Remove the hassle of constructing intricate valuation models from scratch.
How It Functions
- Step 1: Download the Excel file.
- Step 2: Examine Aeon Co., Ltd.'s pre-filled financial data and projections.
- Step 3: Adjust key inputs such as revenue growth, WACC, and tax rates (highlighted cells).
- Step 4: Observe the DCF model refresh in real-time as you modify your assumptions.
- Step 5: Evaluate the outputs and leverage the results for your investment decisions.
Why Choose the Aeon Co., Ltd. (8267T) Calculator?
- All-in-One Solution: Combines DCF, WACC, and comprehensive financial ratio analyses in a single tool.
- Flexible Inputs: Modify the yellow-highlighted cells to experiment with different scenarios.
- In-Depth Analysis: Automatically computes Aeon’s intrinsic value and Net Present Value.
- Preloaded Information: Access to historical and forecasted data for precise starting points.
- High Standards: Perfect for financial analysts, investors, and business consultants alike.
Who Can Benefit from This Product?
- Individual Investors: Make informed decisions about buying or selling Aeon Co., Ltd. (8267T) stock.
- Financial Analysts: Simplify valuation processes with ready-to-use financial models tailored for Aeon Co., Ltd. (8267T).
- Consultants: Provide clients with accurate and timely valuation insights regarding Aeon Co., Ltd. (8267T).
- Business Owners: Gain an understanding of how large companies like Aeon Co., Ltd. (8267T) are valued to inform your strategic decisions.
- Finance Students: Master valuation techniques using real-world data and scenarios from Aeon Co., Ltd. (8267T).
Contents of the Template
- Preloaded AEON Data: Historical and projected financial details, including revenue, EBIT, and capital expenditures.
- DCF and WACC Models: Advanced spreadsheets for determining intrinsic value and Weighted Average Cost of Capital.
- Editable Inputs: Yellow-highlighted cells for modifying revenue growth, tax rates, and discount rates.
- Financial Statements: Detailed annual and quarterly financials for thorough analysis.
- Key Ratios: Metrics for profitability, leverage, and efficiency to assess performance.
- Dashboard and Charts: Visual representations of valuation results and underlying assumptions.
Disclaimer
All information, articles, and product details provided on this website are for general informational and educational purposes only. We do not claim any ownership over, nor do we intend to infringe upon, any trademarks, copyrights, logos, brand names, or other intellectual property mentioned or depicted on this site. Such intellectual property remains the property of its respective owners, and any references here are made solely for identification or informational purposes, without implying any affiliation, endorsement, or partnership.
We make no representations or warranties, express or implied, regarding the accuracy, completeness, or suitability of any content or products presented. Nothing on this website should be construed as legal, tax, investment, financial, medical, or other professional advice. In addition, no part of this site—including articles or product references—constitutes a solicitation, recommendation, endorsement, advertisement, or offer to buy or sell any securities, franchises, or other financial instruments, particularly in jurisdictions where such activity would be unlawful.
All content is of a general nature and may not address the specific circumstances of any individual or entity. It is not a substitute for professional advice or services. Any actions you take based on the information provided here are strictly at your own risk. You accept full responsibility for any decisions or outcomes arising from your use of this website and agree to release us from any liability in connection with your use of, or reliance upon, the content or products found herein.