
|
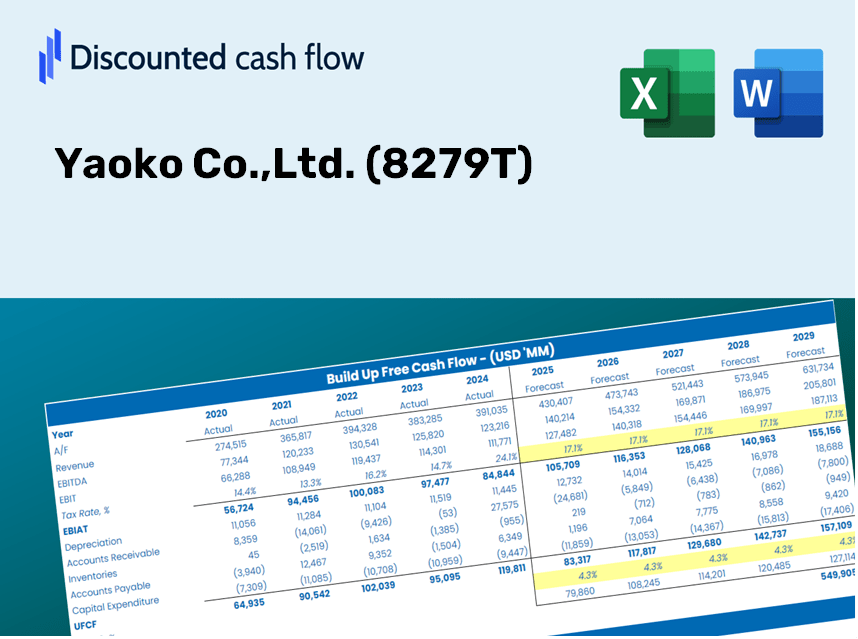
Yaoko Co., Ltd. (8279.T) Valoración de DCF |
Completamente Editable: Adáptelo A Sus Necesidades En Excel O Sheets
Diseño Profesional: Plantillas Confiables Y Estándares De La Industria
Predeterminadas Para Un Uso Rápido Y Eficiente
Compatible con MAC / PC, completamente desbloqueado
No Se Necesita Experiencia; Fáciles De Seguir
Yaoko Co.,Ltd. (8279.T) Bundle
Ya sea que sea un inversor o un analista, esta calculadora DCF (8279T) es su herramienta definitiva para una valoración precisa. Precedidos con datos reales de Yaoko Co., Ltd., puede ajustar los pronósticos y observar instantáneamente los efectos.
Benefits You Will Receive
- Comprehensive YAOKO Financials: Access to both historical and projected data for precise valuation.
- Customizable Inputs: Adjust WACC, tax rates, revenue growth, and capital expenditures to suit your needs.
- Real-Time Calculations: Intrinsic value and NPV are calculated automatically as inputs change.
- Scenario Modeling: Explore various scenarios to assess Yaoko Co., Ltd.'s future performance.
- User-Friendly Design: Designed for industry professionals while remaining easy to navigate for newcomers.
Key Features
- 🔍 Real-Life YAOKO Financials: Pre-filled historical and projected data for Yaoko Co., Ltd. (8279T).
- ✏️ Fully Customizable Inputs: Adjust all essential parameters (yellow cells) such as WACC, growth %, and tax rates.
- 📊 Professional DCF Valuation: Integrated formulas calculate Yaoko’s intrinsic value using the Discounted Cash Flow method.
- ⚡ Instant Results: Visualize Yaoko’s valuation immediately after making any adjustments.
- Scenario Analysis: Evaluate and compare different outcomes based on various financial assumptions side-by-side.
How It Operates
- Download the Template: Gain immediate access to the Excel-based Yaoko Co., Ltd. (8279T) DCF Calculator.
- Input Your Assumptions: Modify the yellow-highlighted cells for growth rates, WACC, margins, and other parameters.
- Instant Calculations: The model automatically recalculates Yaoko’s intrinsic value.
- Test Scenarios: Experiment with various assumptions to assess potential changes in valuation.
- Analyze and Decide: Utilize the results to inform your investment or financial decisions.
Why Opt for This Calculator for Yaoko Co., Ltd. (8279T)?
- Precision: Utilize authentic Yaoko financials for reliable data.
- Versatility: Crafted for users to easily test and adjust inputs as needed.
- Efficiency: Eliminate the complexity of starting a DCF model from the ground up.
- Executive-Quality: Built with the precision and usability expected at the CFO level.
- Accessible: Intuitive design makes it user-friendly, even for those lacking advanced financial modeling skills.
Who Can Benefit from Yaoko Co., Ltd. (8279T)?
- Investors: Gain assurance in your investment choices with our advanced valuation tools.
- Financial Analysts: Enhance your efficiency with a customizable DCF model designed for your needs.
- Consultants: Seamlessly modify the template for impactful client presentations or detailed reports.
- Finance Enthusiasts: Expand your knowledge of valuation strategies through practical, real-world examples.
- Educators and Students: Leverage this as a hands-on educational resource for finance-related studies.
Contents of the Template
- Comprehensive DCF Model: An editable template featuring intricate valuation calculations.
- Practical Data: Yaoko Co.,Ltd.'s (8279T) historical and projected financials included for thorough analysis.
- Adjustable Variables: Modify WACC, growth rates, and tax assumptions to evaluate different scenarios.
- Financial Statements: Complete annual and quarterly financial breakdowns for enhanced insights.
- Key Financial Ratios: Integrated analysis covering profitability, efficiency, and leverage metrics.
- Dashboard with Visual Outputs: Graphs and tables providing clear and actionable insights.
Disclaimer
All information, articles, and product details provided on this website are for general informational and educational purposes only. We do not claim any ownership over, nor do we intend to infringe upon, any trademarks, copyrights, logos, brand names, or other intellectual property mentioned or depicted on this site. Such intellectual property remains the property of its respective owners, and any references here are made solely for identification or informational purposes, without implying any affiliation, endorsement, or partnership.
We make no representations or warranties, express or implied, regarding the accuracy, completeness, or suitability of any content or products presented. Nothing on this website should be construed as legal, tax, investment, financial, medical, or other professional advice. In addition, no part of this site—including articles or product references—constitutes a solicitation, recommendation, endorsement, advertisement, or offer to buy or sell any securities, franchises, or other financial instruments, particularly in jurisdictions where such activity would be unlawful.
All content is of a general nature and may not address the specific circumstances of any individual or entity. It is not a substitute for professional advice or services. Any actions you take based on the information provided here are strictly at your own risk. You accept full responsibility for any decisions or outcomes arising from your use of this website and agree to release us from any liability in connection with your use of, or reliance upon, the content or products found herein.