
|
Fukuoka Financial Group, Inc. (8354.T) Valoración de DCF |
Completamente Editable: Adáptelo A Sus Necesidades En Excel O Sheets
Diseño Profesional: Plantillas Confiables Y Estándares De La Industria
Predeterminadas Para Un Uso Rápido Y Eficiente
Compatible con MAC / PC, completamente desbloqueado
No Se Necesita Experiencia; Fáciles De Seguir
Fukuoka Financial Group, Inc. (8354.T) Bundle
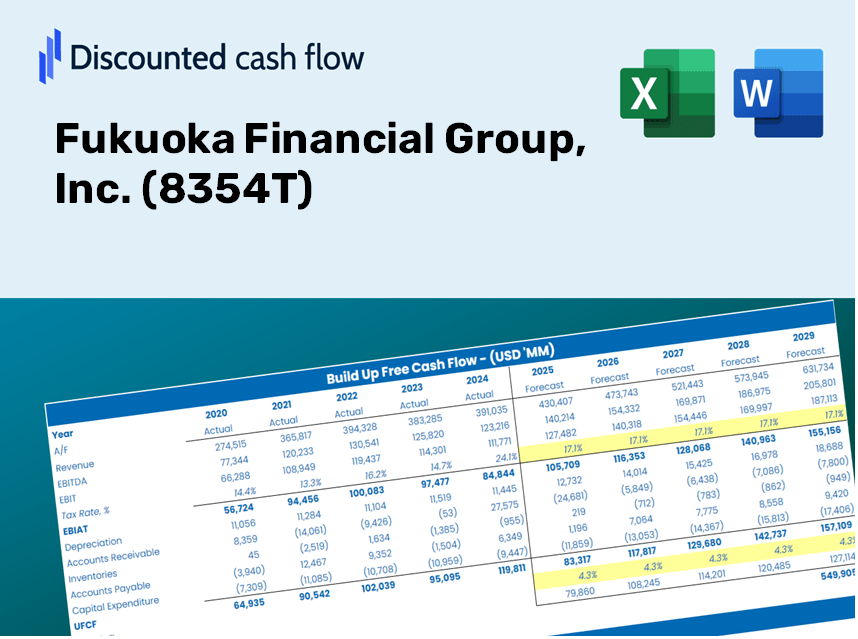
Ya sea que sea un inversionista o analista, esta calculadora DCF de Fukuoka Financial Group, Inc. (8354T) es su herramienta de referencia para una valoración precisa. Precedidos con datos reales de Fukuoka Financial Group, puede ajustar los pronósticos y observar los efectos en tiempo real.
Discounted Cash Flow (DCF) - (USD MM)
| Year | AY1 2021 |
AY2 2022 |
AY3 2023 |
AY4 2024 |
AY5 2025 |
FY1 2026 |
FY2 2027 |
FY3 2028 |
FY4 2029 |
FY5 2030 |
|---|---|---|---|---|---|---|---|---|---|---|
| Revenue | 258,504.0 | 254,740.0 | 306,566.0 | 378,179.0 | 318,236.0 | 339,237.9 | 361,625.8 | 385,491.2 | 410,931.6 | 438,050.9 |
| Revenue Growth, % | 0 | -1.46 | 20.34 | 23.36 | -15.85 | 6.6 | 6.6 | 6.6 | 6.6 | 6.6 |
| EBITDA | 71,601.0 | 87,440.0 | 57,197.0 | 90,109.0 | 96,226.0 | 91,421.3 | 97,454.6 | 103,886.1 | 110,742.1 | 118,050.5 |
| EBITDA, % | 27.7 | 34.33 | 18.66 | 23.83 | 30.24 | 26.95 | 26.95 | 26.95 | 26.95 | 26.95 |
| Depreciation | 12,271.0 | 12,278.0 | 11,957.0 | 12,618.0 | 13,599.0 | 14,300.1 | 15,243.8 | 16,249.8 | 17,322.3 | 18,465.4 |
| Depreciation, % | 4.75 | 4.82 | 3.9 | 3.34 | 4.27 | 4.22 | 4.22 | 4.22 | 4.22 | 4.22 |
| EBIT | 59,330.0 | 75,162.0 | 45,240.0 | 77,491.0 | 82,627.0 | 77,121.2 | 82,210.8 | 87,636.3 | 93,419.8 | 99,585.0 |
| EBIT, % | 22.95 | 29.51 | 14.76 | 20.49 | 25.96 | 22.73 | 22.73 | 22.73 | 22.73 | 22.73 |
| Total Cash | 6,086,101.0 | 7,849,025.0 | 7,713,590.0 | 8,449,933.0 | 7,160,305.0 | 339,237.9 | 361,625.8 | 385,491.2 | 410,931.6 | 438,050.9 |
| Total Cash, percent | .0 | .0 | .0 | .0 | .0 | .0 | .0 | .0 | .0 | .0 |
| Account Receivables | .0 | .0 | .0 | .0 | .0 | .0 | .0 | .0 | .0 | .0 |
| Account Receivables, % | 0 | 0 | 0 | 0 | 0 | 0 | 0 | 0 | 0 | 0 |
| Inventories | .0 | .0 | .0 | .0 | .0 | .0 | .0 | .0 | .0 | .0 |
| Inventories, % | 0 | 0 | 0 | 0 | 0 | 0 | 0 | 0 | 0 | 0 |
| Accounts Payable | .0 | .0 | .0 | .0 | .0 | .0 | .0 | .0 | .0 | .0 |
| Accounts Payable, % | 0 | 0 | 0 | 0 | 0 | 0 | 0 | 0 | 0 | 0 |
| Capital Expenditure | -10,462.0 | -11,175.0 | -18,802.0 | -10,304.0 | -6,294.0 | -13,073.9 | -13,936.7 | -14,856.4 | -15,836.9 | -16,882.0 |
| Capital Expenditure, % | -4.05 | -4.39 | -6.13 | -2.72 | -1.98 | -3.85 | -3.85 | -3.85 | -3.85 | -3.85 |
| Tax Rate, % | 30.44 | 30.44 | 30.44 | 30.44 | 30.44 | 30.44 | 30.44 | 30.44 | 30.44 | 30.44 |
| EBITAT | 44,647.0 | 54,118.0 | 31,152.0 | 61,178.0 | 57,472.2 | 56,239.5 | 59,951.1 | 63,907.5 | 68,125.1 | 72,621.0 |
| Depreciation | ||||||||||
| Changes in Account Receivables | ||||||||||
| Changes in Inventories | ||||||||||
| Changes in Accounts Payable | ||||||||||
| Capital Expenditure | ||||||||||
| UFCF | 46,456.0 | 55,221.0 | 24,307.0 | 63,492.0 | 64,777.2 | 57,465.8 | 61,258.2 | 65,300.9 | 69,610.4 | 74,204.4 |
| WACC, % | 2.85 | 2.74 | 2.64 | 2.97 | 2.66 | 2.77 | 2.77 | 2.77 | 2.77 | 2.77 |
| PV UFCF | ||||||||||
| SUM PV UFCF | 301,179.5 | |||||||||
| Long Term Growth Rate, % | 2.00 | |||||||||
| Free cash flow (T + 1) | 75,688 | |||||||||
| Terminal Value | 9,784,613 | |||||||||
| Present Terminal Value | 8,533,692 | |||||||||
| Enterprise Value | 8,834,871 | |||||||||
| Net Debt | 9,078,865 | |||||||||
| Equity Value | -243,994 | |||||||||
| Diluted Shares Outstanding, MM | 189 | |||||||||
| Equity Value Per Share | -1,290.53 |
Benefits You Will Receive
- Accurate Fukuoka Financial Data: Pre-loaded with historical and projected data for in-depth analysis of Fukuoka Financial Group, Inc. (8354T).
- Completely Customizable Template: Easily adjust crucial inputs such as revenue growth, WACC, and EBITDA margin.
- Instant Calculations: Watch the intrinsic value of Fukuoka Financial Group, Inc. (8354T) update in real-time as you make adjustments.
- Dedicated Valuation Tool: Tailored for investors, analysts, and consultants seeking precise DCF outcomes.
- Intuitive Design: A straightforward layout with clear instructions suitable for all skill levels.
Key Features
- Comprehensive DCF Calculator: Offers detailed unlevered and levered DCF valuation models tailored for Fukuoka Financial Group, Inc. (8354T).
- WACC Calculator: Features a pre-built Weighted Average Cost of Capital sheet with customizable inputs specific to (8354T).
- Customizable Forecast Assumptions: Adjust growth rates, capital expenditures, and discount rates to fit your analysis for Fukuoka Financial Group, Inc. (8354T).
- Integrated Financial Ratios: Evaluate profitability, leverage, and efficiency ratios specific to Fukuoka Financial Group, Inc. (8354T).
- User-Friendly Dashboard and Charts: Visual outputs provide a summary of key valuation metrics for straightforward analysis of (8354T).
How It Functions
- Download the Template: Gain immediate access to the Excel-based Fukuoka Financial Group DCF Calculator.
- Input Your Assumptions: Modify the yellow-highlighted cells for growth rates, WACC, margins, and additional factors.
- Instant Calculations: The model automatically updates the intrinsic value of Fukuoka Financial Group, Inc. ([8354T]).
- Test Scenarios: Experiment with various assumptions to assess potential changes in valuation.
- Analyze and Decide: Utilize the results to inform your investment or financial strategy.
Why Opt for the Fukuoka Financial Group Calculator?
- Precision: Leveraging authentic financial data from Fukuoka Financial Group, Inc. ([8354T]) for reliable results.
- Versatility: Crafted to empower users to experiment with and adjust inputs at their discretion.
- Efficiency: Eliminate the complexities of constructing a DCF model from the ground up.
- Expert-Quality: Engineered with the finesse and usability expected by finance professionals.
- Intuitive Design: Simple to navigate, making it accessible for users with varying levels of financial modeling experience.
Who Can Benefit from This Product?
- Investors: Effectively assess Fukuoka Financial Group, Inc.'s (8354T) intrinsic value prior to making investment choices.
- CFOs: Utilize a robust DCF model for financial reporting and comprehensive analysis.
- Consultants: Swiftly customize the template to create valuation reports for clients.
- Entrepreneurs: Understand financial modeling techniques employed by leading financial institutions.
- Educators: Employ it as an educational resource to illustrate various valuation methodologies.
Contents of the Template
- Comprehensive DCF Model: An editable template featuring thorough valuation calculations.
- Real-World Data: Fukuoka Financial Group, Inc.'s (8354T) historical and projected financial data preloaded for easy analysis.
- Customizable Parameters: Modify WACC, growth rates, and tax assumptions to explore different scenarios.
- Financial Statements: Complete annual and quarterly financial breakdowns for in-depth insights.
- Key Ratios: Integrated analysis for assessing profitability, efficiency, and leverage.
- Dashboard with Visual Outputs: Visualizations including charts and tables for clear, actionable outcomes.
Disclaimer
All information, articles, and product details provided on this website are for general informational and educational purposes only. We do not claim any ownership over, nor do we intend to infringe upon, any trademarks, copyrights, logos, brand names, or other intellectual property mentioned or depicted on this site. Such intellectual property remains the property of its respective owners, and any references here are made solely for identification or informational purposes, without implying any affiliation, endorsement, or partnership.
We make no representations or warranties, express or implied, regarding the accuracy, completeness, or suitability of any content or products presented. Nothing on this website should be construed as legal, tax, investment, financial, medical, or other professional advice. In addition, no part of this site—including articles or product references—constitutes a solicitation, recommendation, endorsement, advertisement, or offer to buy or sell any securities, franchises, or other financial instruments, particularly in jurisdictions where such activity would be unlawful.
All content is of a general nature and may not address the specific circumstances of any individual or entity. It is not a substitute for professional advice or services. Any actions you take based on the information provided here are strictly at your own risk. You accept full responsibility for any decisions or outcomes arising from your use of this website and agree to release us from any liability in connection with your use of, or reliance upon, the content or products found herein.