
|
North Pacific Bank, Ltd. (8524.t) valoración de DCF |
Completamente Editable: Adáptelo A Sus Necesidades En Excel O Sheets
Diseño Profesional: Plantillas Confiables Y Estándares De La Industria
Predeterminadas Para Un Uso Rápido Y Eficiente
Compatible con MAC / PC, completamente desbloqueado
No Se Necesita Experiencia; Fáciles De Seguir
North Pacific Bank,Ltd. (8524.T) Bundle
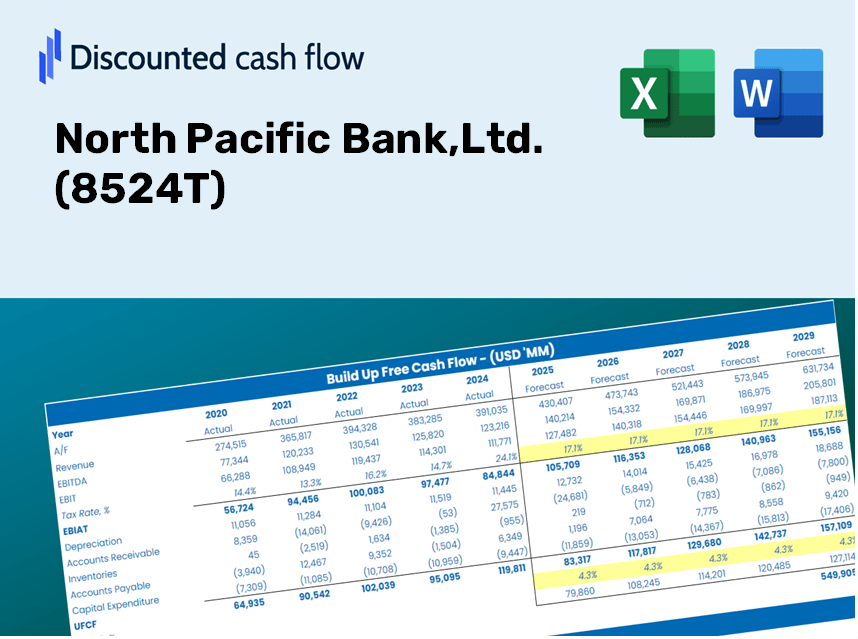
¡Simplifique la valoración de North Pacific Bank, Ltd. (8524T) con esta calculadora DCF personalizable! Con el Real North Pacific Bank, Ltd. (8524T) financieros y entradas de pronóstico ajustables, puede probar escenarios y descubrir el valor razonable de North Pacific Bank, Ltd. (8524T) en minutos.
Discounted Cash Flow (DCF) - (USD MM)
| Year | AY1 2020 |
AY2 2021 |
AY3 2022 |
AY4 2023 |
AY5 2024 |
FY1 2025 |
FY2 2026 |
FY3 2027 |
FY4 2028 |
FY5 2029 |
|---|---|---|---|---|---|---|---|---|---|---|
| Revenue | 116,989.0 | 112,984.0 | 118,954.0 | 126,533.0 | 138,574.0 | 144,722.5 | 151,143.9 | 157,850.1 | 164,853.9 | 172,168.5 |
| Revenue Growth, % | 0 | -3.42 | 5.28 | 6.37 | 9.52 | 4.44 | 4.44 | 4.44 | 4.44 | 4.44 |
| EBITDA | 15,159.0 | 25,195.0 | 23,255.0 | 28,033.0 | 37,585.0 | 30,126.7 | 31,463.4 | 32,859.4 | 34,317.4 | 35,840.0 |
| EBITDA, % | 12.96 | 22.3 | 19.55 | 22.15 | 27.12 | 20.82 | 20.82 | 20.82 | 20.82 | 20.82 |
| Depreciation | .0 | 6,954.0 | 7,444.0 | 9,745.0 | 10,044.0 | 7,919.9 | 8,271.3 | 8,638.3 | 9,021.6 | 9,421.9 |
| Depreciation, % | 0 | 6.15 | 6.26 | 7.7 | 7.25 | 5.47 | 5.47 | 5.47 | 5.47 | 5.47 |
| EBIT | 15,159.0 | 18,241.0 | 15,811.0 | 18,288.0 | 27,541.0 | 22,206.7 | 23,192.1 | 24,221.1 | 25,295.8 | 26,418.2 |
| EBIT, % | 12.96 | 16.14 | 13.29 | 14.45 | 19.87 | 15.34 | 15.34 | 15.34 | 15.34 | 15.34 |
| Total Cash | 2,625,082.0 | 4,338,005.0 | 2,796,033.0 | 3,060,635.0 | 2,653,639.0 | 144,722.5 | 151,143.9 | 157,850.1 | 164,853.9 | 172,168.5 |
| Total Cash, percent | .0 | .0 | .0 | .0 | .0 | .0 | .0 | .0 | .0 | .0 |
| Account Receivables | .0 | .0 | .0 | .0 | .0 | .0 | .0 | .0 | .0 | .0 |
| Account Receivables, % | 0 | 0 | 0 | 0 | 0 | 0 | 0 | 0 | 0 | 0 |
| Inventories | .0 | .0 | .0 | .0 | .0 | .0 | .0 | .0 | .0 | .0 |
| Inventories, % | 0 | 0 | 0 | 0 | 0 | 0 | 0 | 0 | 0 | 0 |
| Accounts Payable | .0 | .0 | .0 | .0 | .0 | .0 | .0 | .0 | .0 | .0 |
| Accounts Payable, % | 0 | 0 | 0 | 0 | 0 | 0 | 0 | 0 | 0 | 0 |
| Capital Expenditure | -2,988.0 | -2,442.0 | -4,569.0 | -2,293.0 | -5,391.0 | -4,127.2 | -4,310.3 | -4,501.6 | -4,701.3 | -4,909.9 |
| Capital Expenditure, % | -2.55 | -2.16 | -3.84 | -1.81 | -3.89 | -2.85 | -2.85 | -2.85 | -2.85 | -2.85 |
| Tax Rate, % | 25.17 | 25.17 | 25.17 | 25.17 | 25.17 | 25.17 | 25.17 | 25.17 | 25.17 | 25.17 |
| EBITAT | 9,710.9 | 11,756.0 | 9,647.6 | 12,830.0 | 20,608.0 | 14,856.7 | 15,515.9 | 16,204.3 | 16,923.3 | 17,674.2 |
| Depreciation | ||||||||||
| Changes in Account Receivables | ||||||||||
| Changes in Inventories | ||||||||||
| Changes in Accounts Payable | ||||||||||
| Capital Expenditure | ||||||||||
| UFCF | 6,722.9 | 16,268.0 | 12,522.6 | 20,282.0 | 25,261.0 | 18,649.4 | 19,476.9 | 20,341.1 | 21,243.6 | 22,186.2 |
| WACC, % | 3.08 | 3.09 | 2.99 | 3.27 | 3.42 | 3.17 | 3.17 | 3.17 | 3.17 | 3.17 |
| PV UFCF | ||||||||||
| SUM PV UFCF | 92,632.6 | |||||||||
| Long Term Growth Rate, % | 2.00 | |||||||||
| Free cash flow (T + 1) | 22,630 | |||||||||
| Terminal Value | 1,936,140 | |||||||||
| Present Terminal Value | 1,656,512 | |||||||||
| Enterprise Value | 1,749,144 | |||||||||
| Net Debt | -952,467 | |||||||||
| Equity Value | 2,701,611 | |||||||||
| Diluted Shares Outstanding, MM | 382 | |||||||||
| Equity Value Per Share | 7,067.51 |
What You Will Receive
- Customizable Excel Template: A fully adjustable Excel-based DCF Calculator featuring pre-populated financial data for North Pacific Bank, Ltd. (8524T).
- Accurate Financial Data: Access to historical figures and future projections (highlighted in the yellow cells).
- Assumption Flexibility: Modify forecast parameters such as revenue growth, EBITDA %, and WACC.
- Instant Calculations: Quickly understand how your adjustments affect North Pacific Bank's valuation.
- Professional Resource: Designed for investors, CFOs, consultants, and financial analysts.
- Intuitive Layout: Organized for easy navigation and usability, complete with detailed instructions.
Key Features
- 🔍 Real-Life NPB Financials: Pre-filled historical and projected data for North Pacific Bank, Ltd. (8524T).
- ✏️ Fully Customizable Inputs: Modify all essential parameters (yellow cells) including WACC, growth %, and tax rates.
- 📊 Professional DCF Valuation: Integrated formulas calculate North Pacific Bank's intrinsic value using the Discounted Cash Flow method.
- ⚡ Instant Results: Visualize the valuation of North Pacific Bank instantly after adjustments.
- Scenario Analysis: Evaluate and compare different financial assumptions side-by-side.
How It Functions
- Step 1: Download the Excel spreadsheet.
- Step 2: Examine the pre-filled North Pacific Bank, Ltd. (8524T) data (historical and forecasted).
- Step 3: Modify key assumptions (highlighted in yellow) according to your analysis.
- Step 4: Observe the automatic recalculations for North Pacific Bank, Ltd.'s (8524T) intrinsic value.
- Step 5: Utilize the results for investment decisions or reporting purposes.
Why Opt for North Pacific Bank, Ltd. (8524T)?
- User-Friendly Interface: Crafted for both novices and seasoned users.
- Customizable Settings: Easily adjust inputs to tailor your financial analysis.
- Real-Time Adjustments: Observe immediate updates to North Pacific Bank’s valuation with input modifications.
- Pre-Configured Data: Equipped with North Pacific Bank’s current financial metrics for swift evaluations.
- Relied Upon by Experts: Trusted by financial analysts and investors for strategic decision-making.
Who Can Benefit from North Pacific Bank, Ltd. (8524T)?
- Finance Students: Master financial analysis and apply your knowledge to real-world banking scenarios.
- Academics: Integrate cutting-edge banking models into your educational programs or scholarly research.
- Investors: Evaluate your investment strategies and assess financial performance for North Pacific Bank, Ltd. (8524T).
- Analysts: Enhance your analysis process with a tailor-made financial model designed for banking institutions.
- Small Business Owners: Learn how major banks like North Pacific Bank, Ltd. (8524T) are evaluated and analyzed.
Contents of the Template
- Pre-Filled Data: Contains North Pacific Bank, Ltd.'s historical financials and projections.
- Discounted Cash Flow Model: An editable DCF valuation model with automated calculations.
- Weighted Average Cost of Capital (WACC): A separate sheet designed for WACC calculation based on user-defined inputs.
- Key Financial Ratios: Evaluate North Pacific Bank’s profitability, efficiency, and leverage metrics.
- Customizable Inputs: Easily modify revenue growth, profit margins, and tax rates.
- User-Friendly Dashboard: Visual representations and tables that summarize essential valuation outcomes.
Disclaimer
All information, articles, and product details provided on this website are for general informational and educational purposes only. We do not claim any ownership over, nor do we intend to infringe upon, any trademarks, copyrights, logos, brand names, or other intellectual property mentioned or depicted on this site. Such intellectual property remains the property of its respective owners, and any references here are made solely for identification or informational purposes, without implying any affiliation, endorsement, or partnership.
We make no representations or warranties, express or implied, regarding the accuracy, completeness, or suitability of any content or products presented. Nothing on this website should be construed as legal, tax, investment, financial, medical, or other professional advice. In addition, no part of this site—including articles or product references—constitutes a solicitation, recommendation, endorsement, advertisement, or offer to buy or sell any securities, franchises, or other financial instruments, particularly in jurisdictions where such activity would be unlawful.
All content is of a general nature and may not address the specific circumstances of any individual or entity. It is not a substitute for professional advice or services. Any actions you take based on the information provided here are strictly at your own risk. You accept full responsibility for any decisions or outcomes arising from your use of this website and agree to release us from any liability in connection with your use of, or reliance upon, the content or products found herein.